See how one call to set.seed() in R creates an entire predetermined universe of pseudorandom numbers
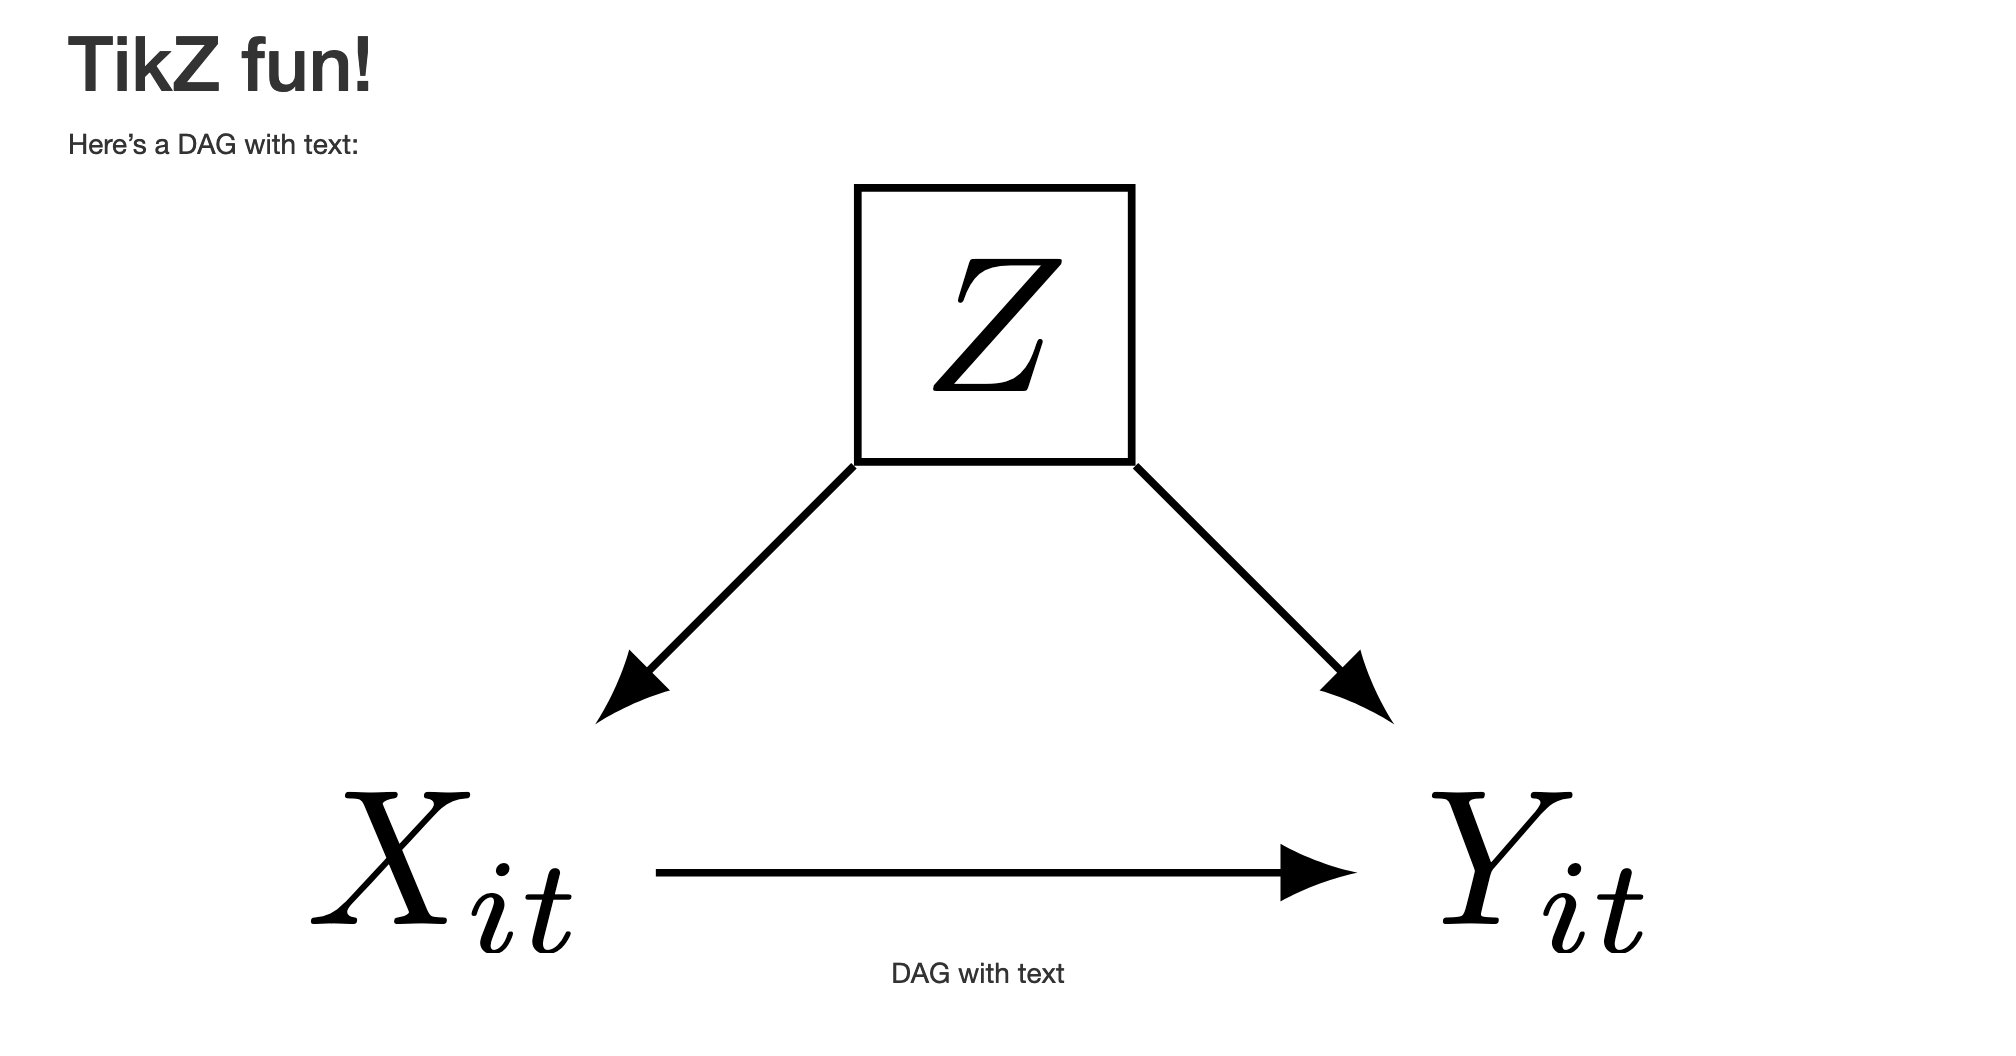
Make Quarto convert TikZ graphics to SVG files when rendering to non-LaTeX outputs like HTML, Word, and Typst
Links and resources from my time on Posit’s Data Science Lab in January 2026
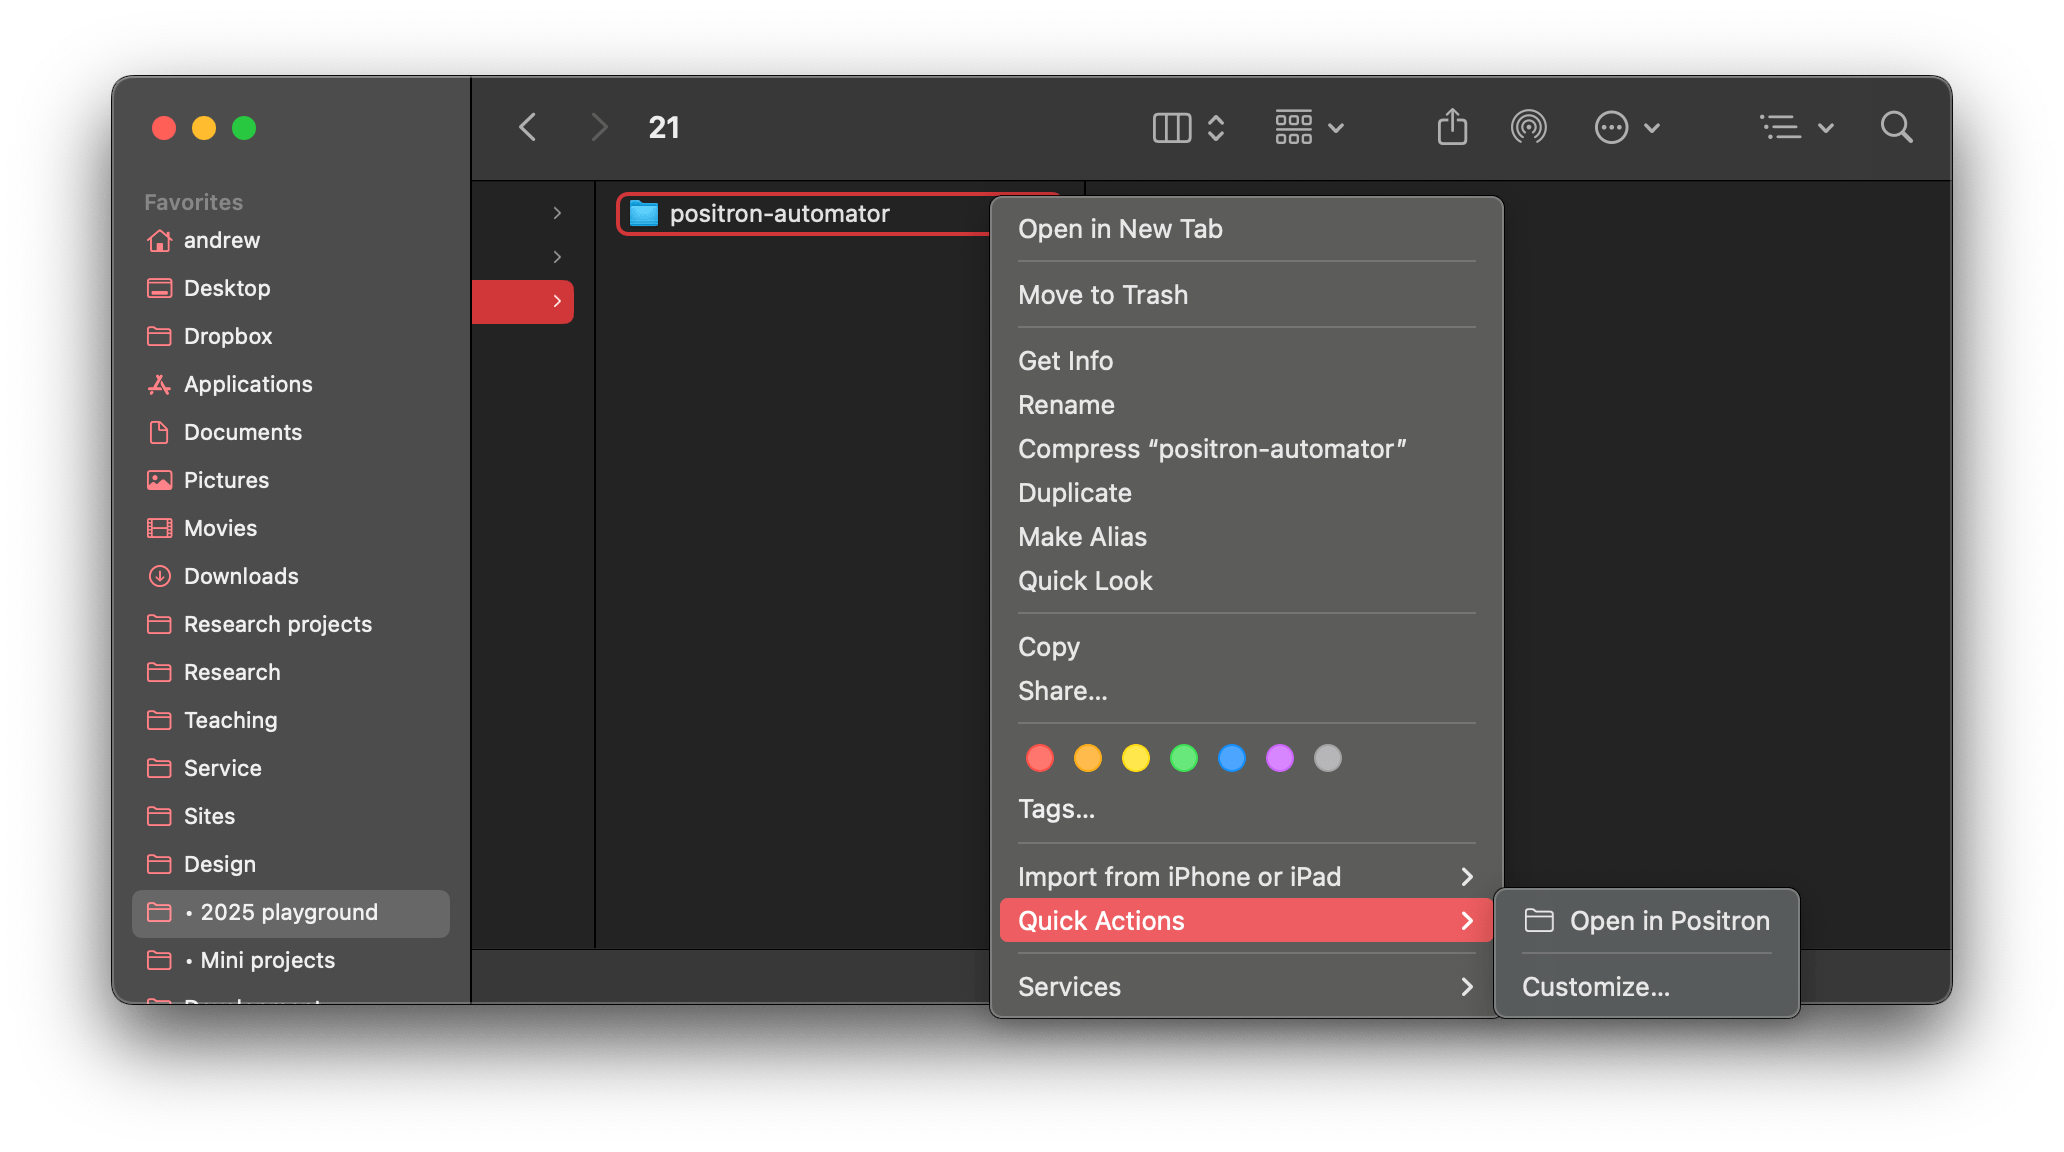
Add a Quick Action workflow so that you can right click on a folder in Finder to open it in Positron.
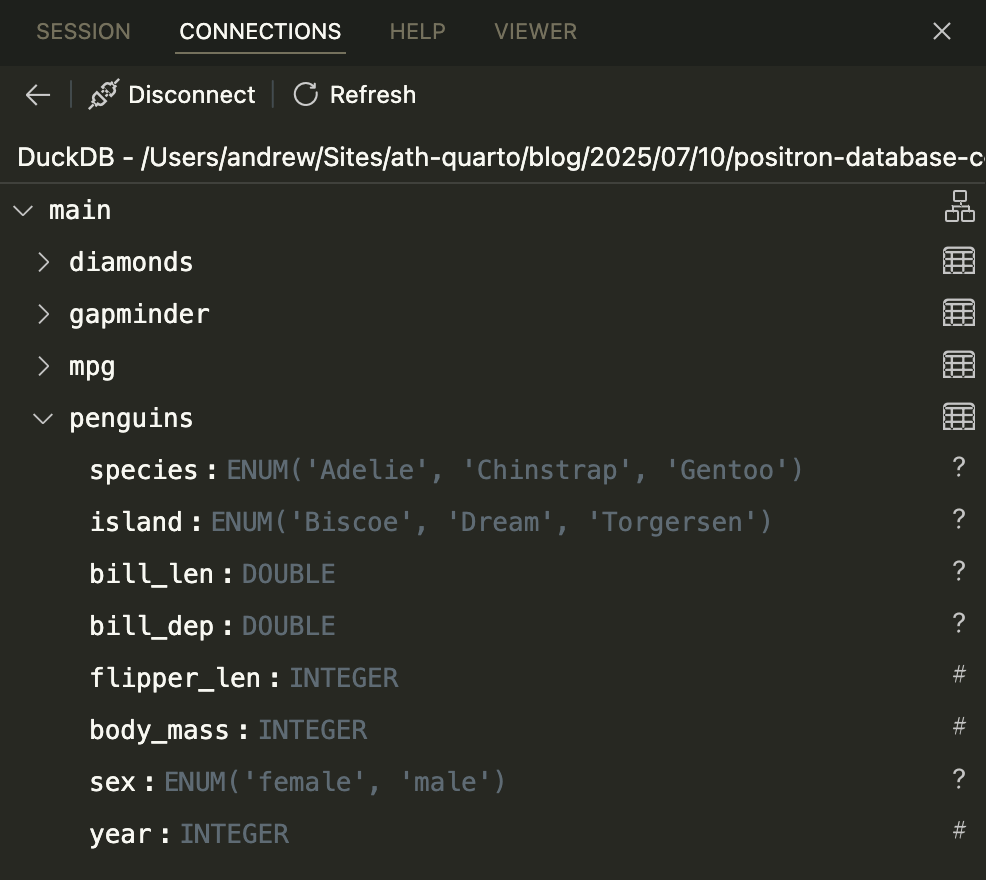
Positron’s Connections Pane makes it really convenient to work with most types of databases—here’s how to connect to lighting fast DuckDB files.
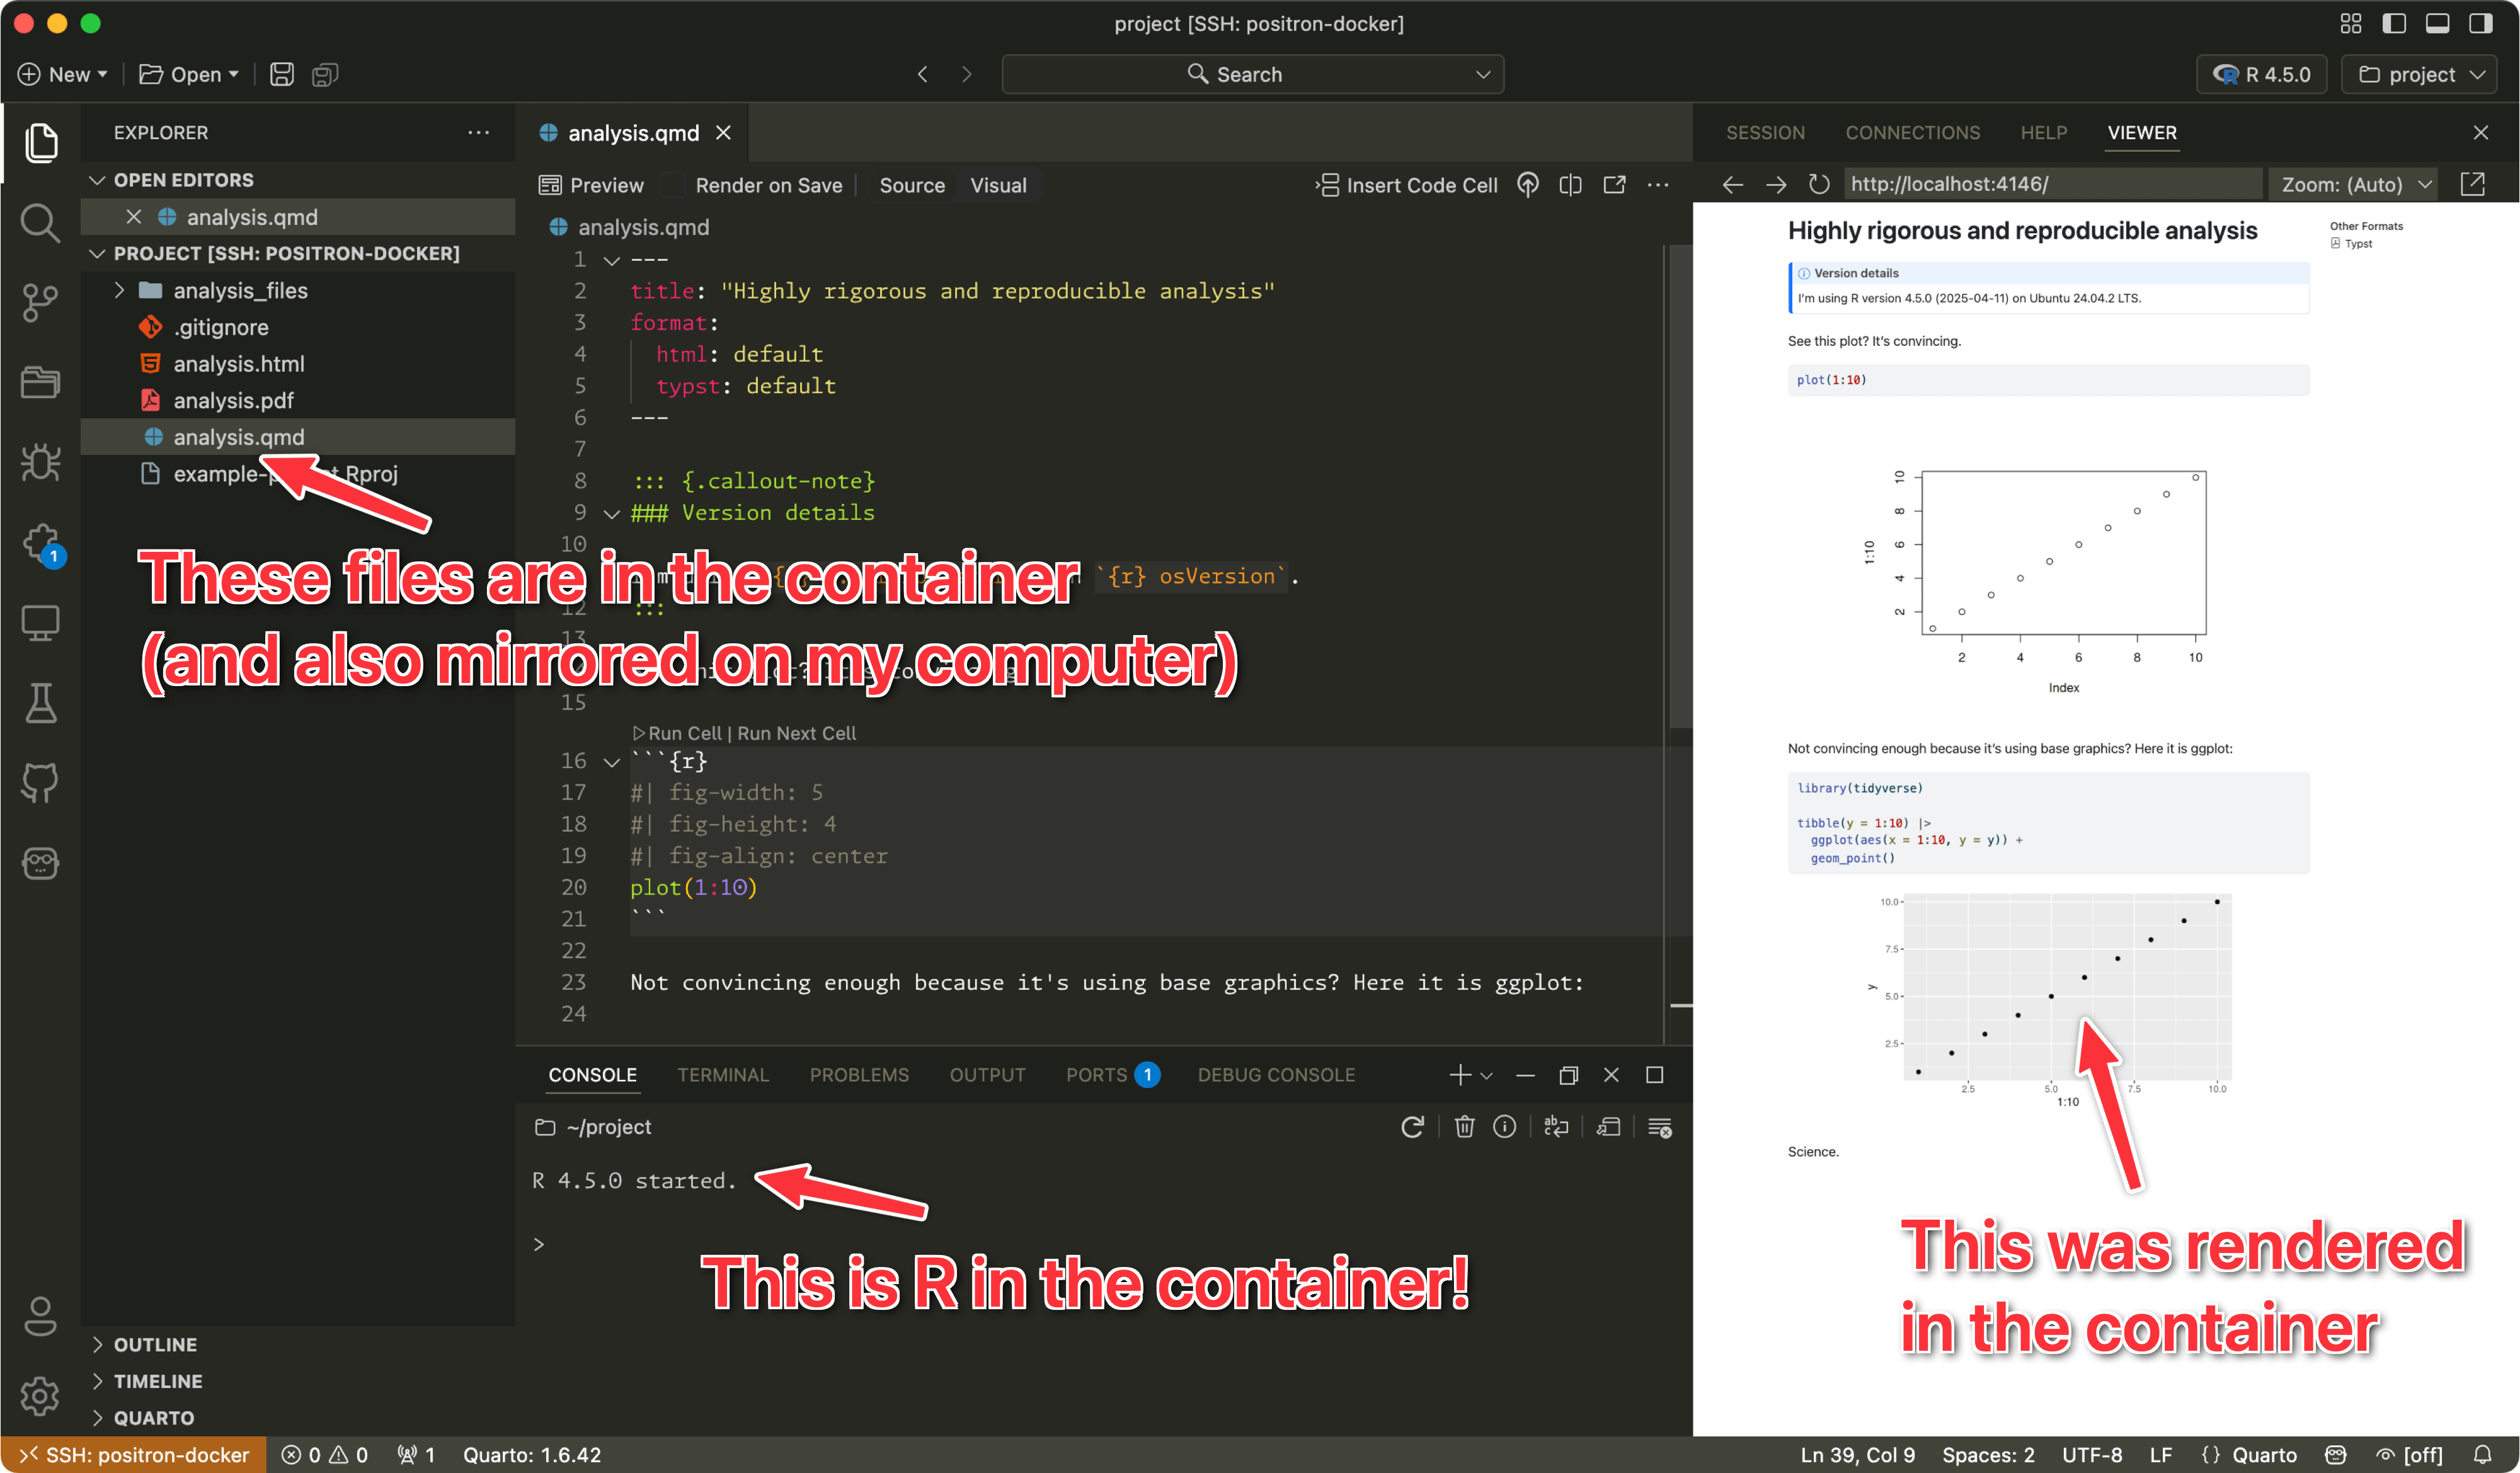
Running R in Docker containers is great for reproducible projects, but writing and running code in the container can be a hassle. Use Positron to SSH into local Docker containers instead!
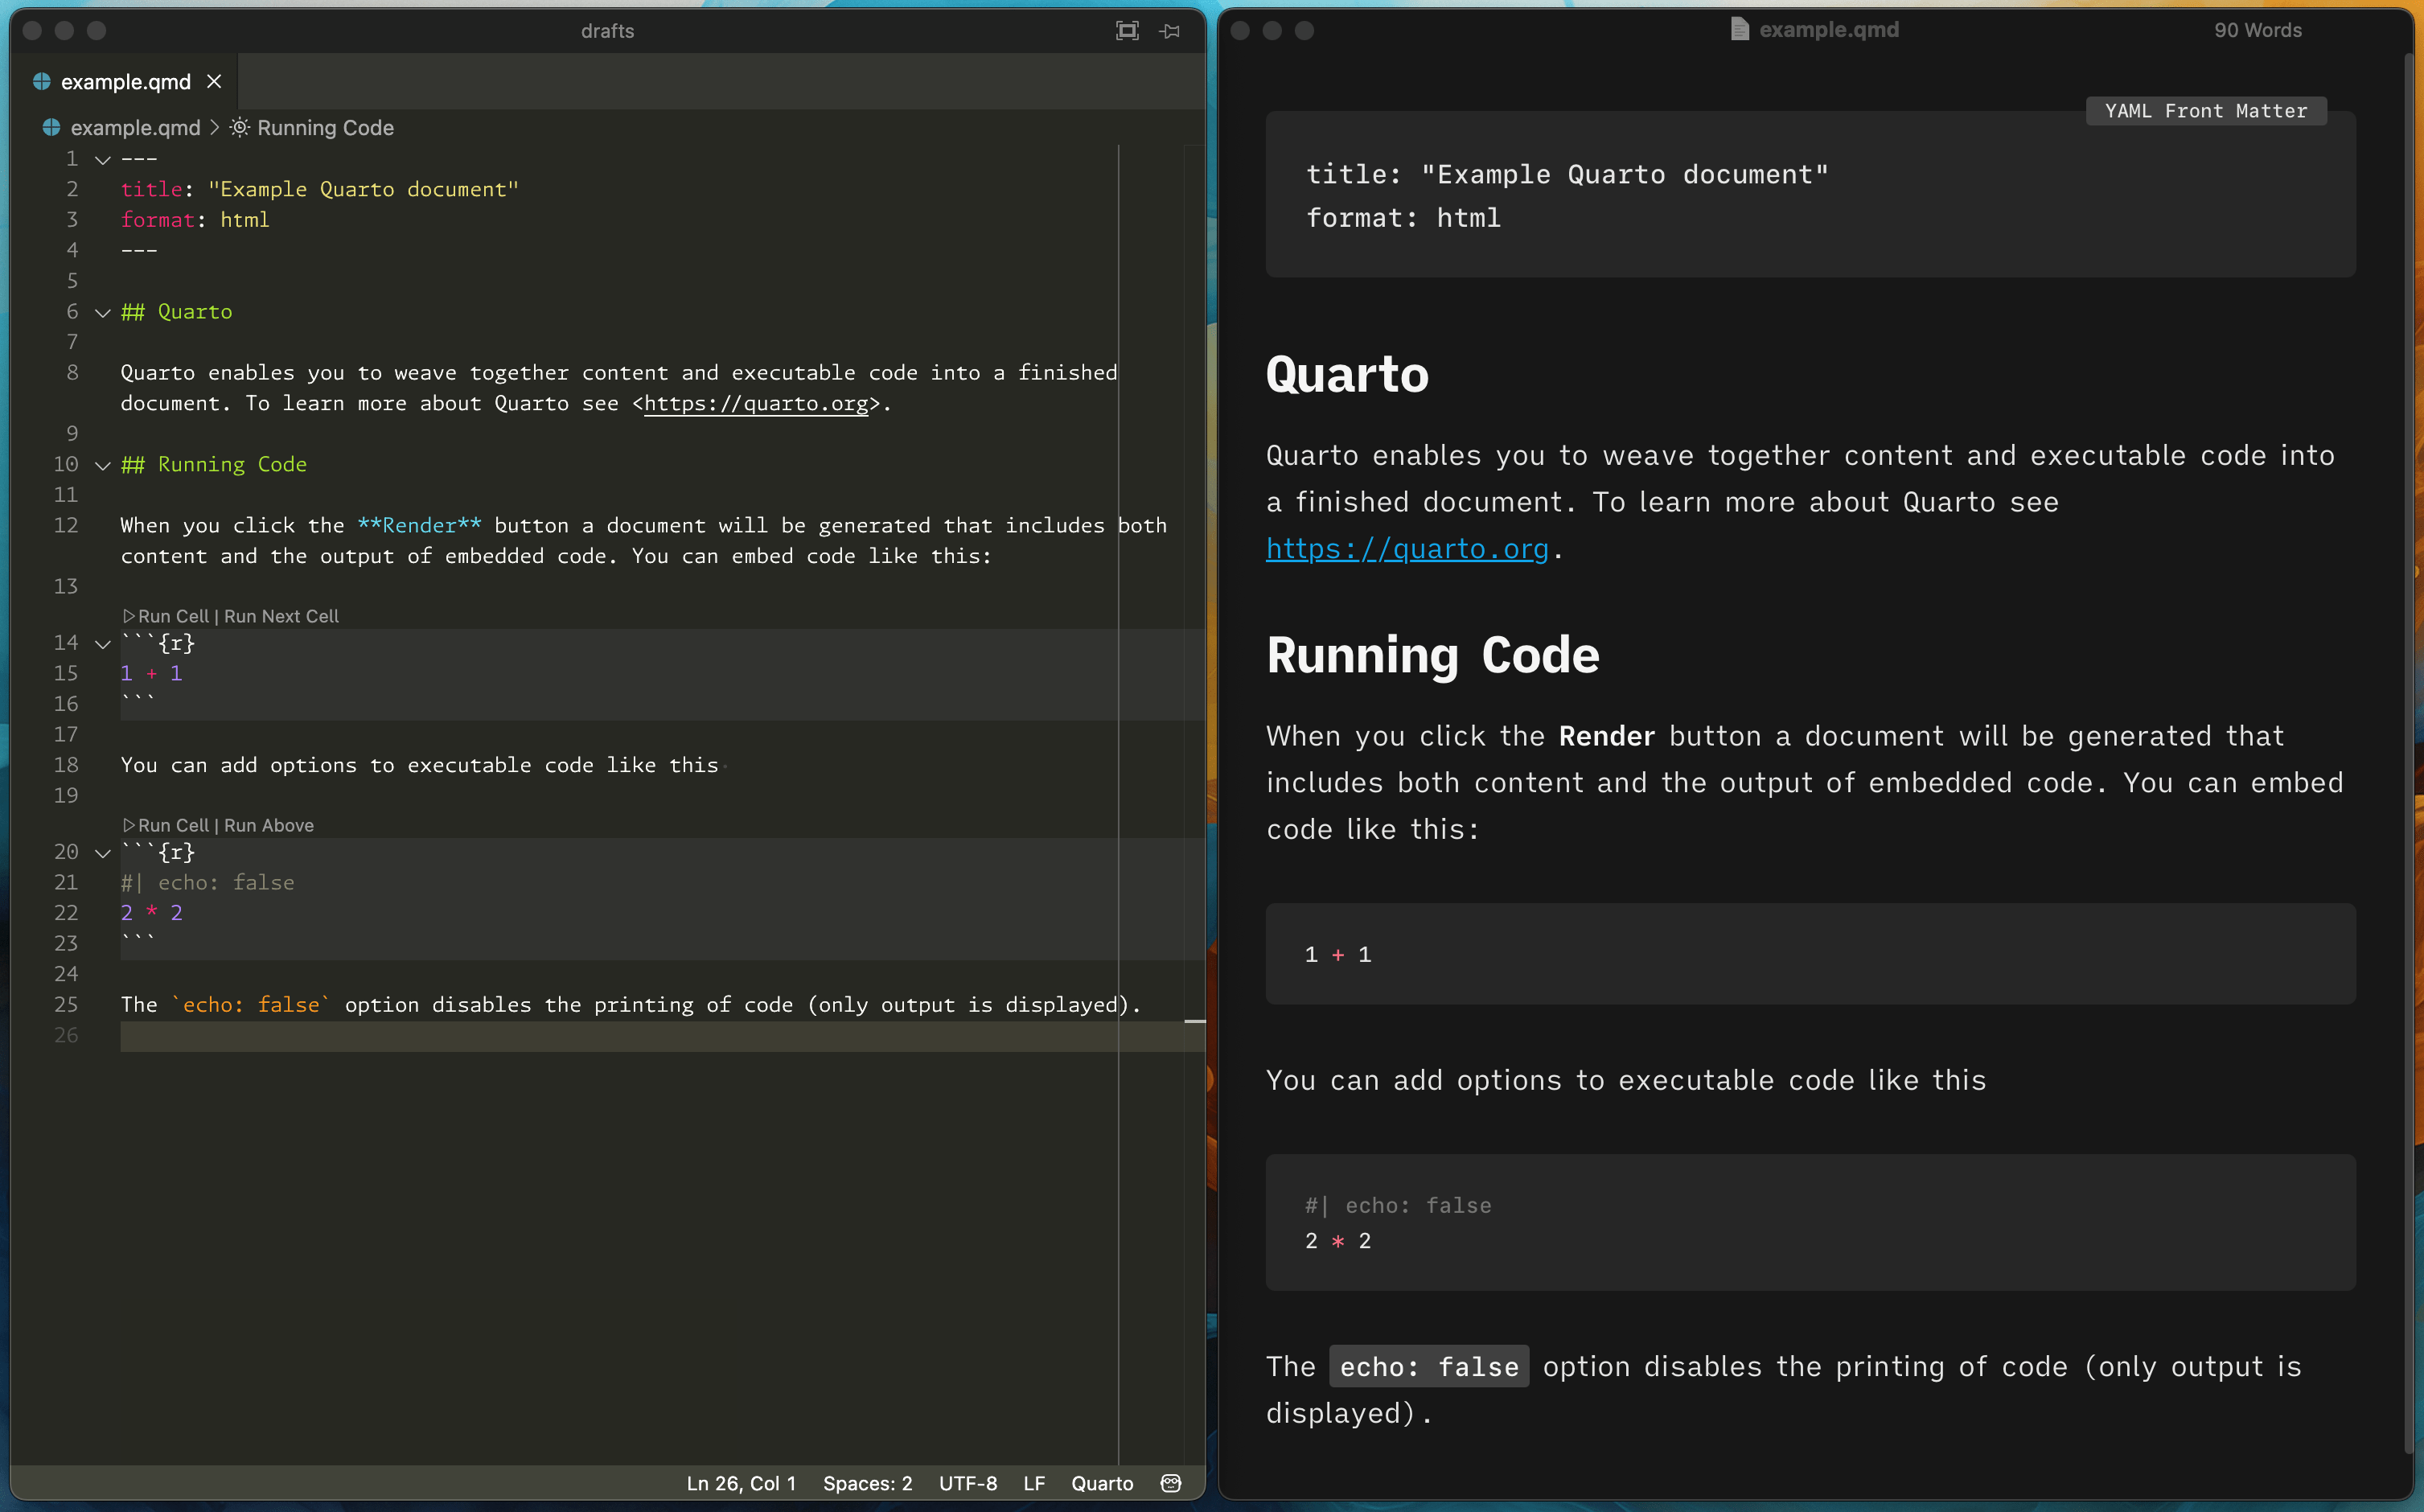
Positron is great for code, but macOS has better programs specifically for writing with Markdown. Quickly open a Quarto file in an external program with tasks.
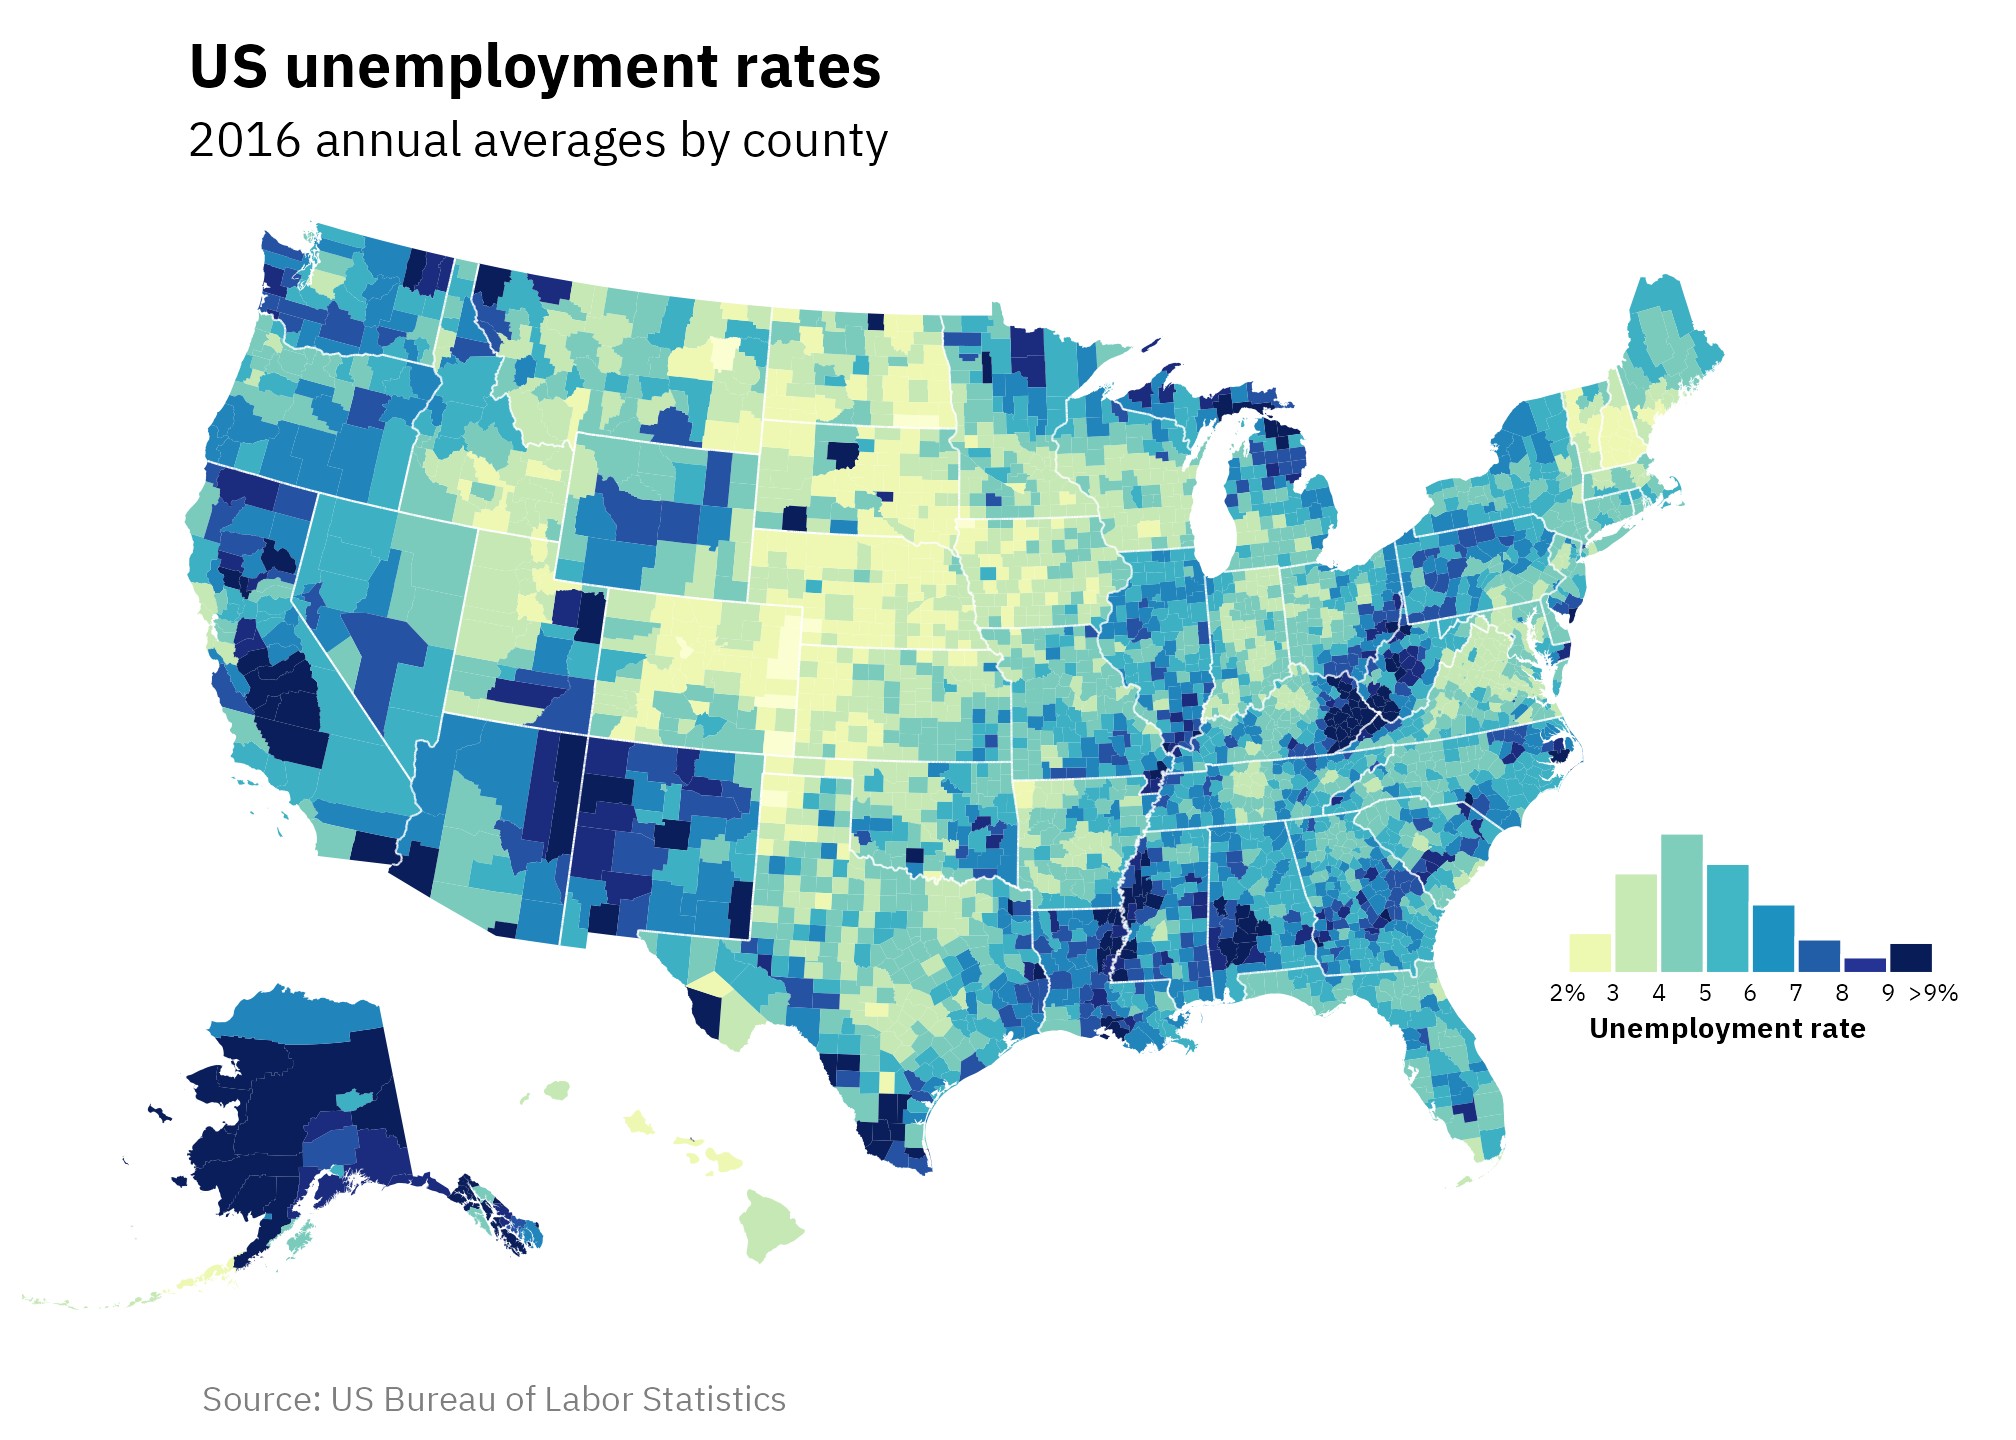
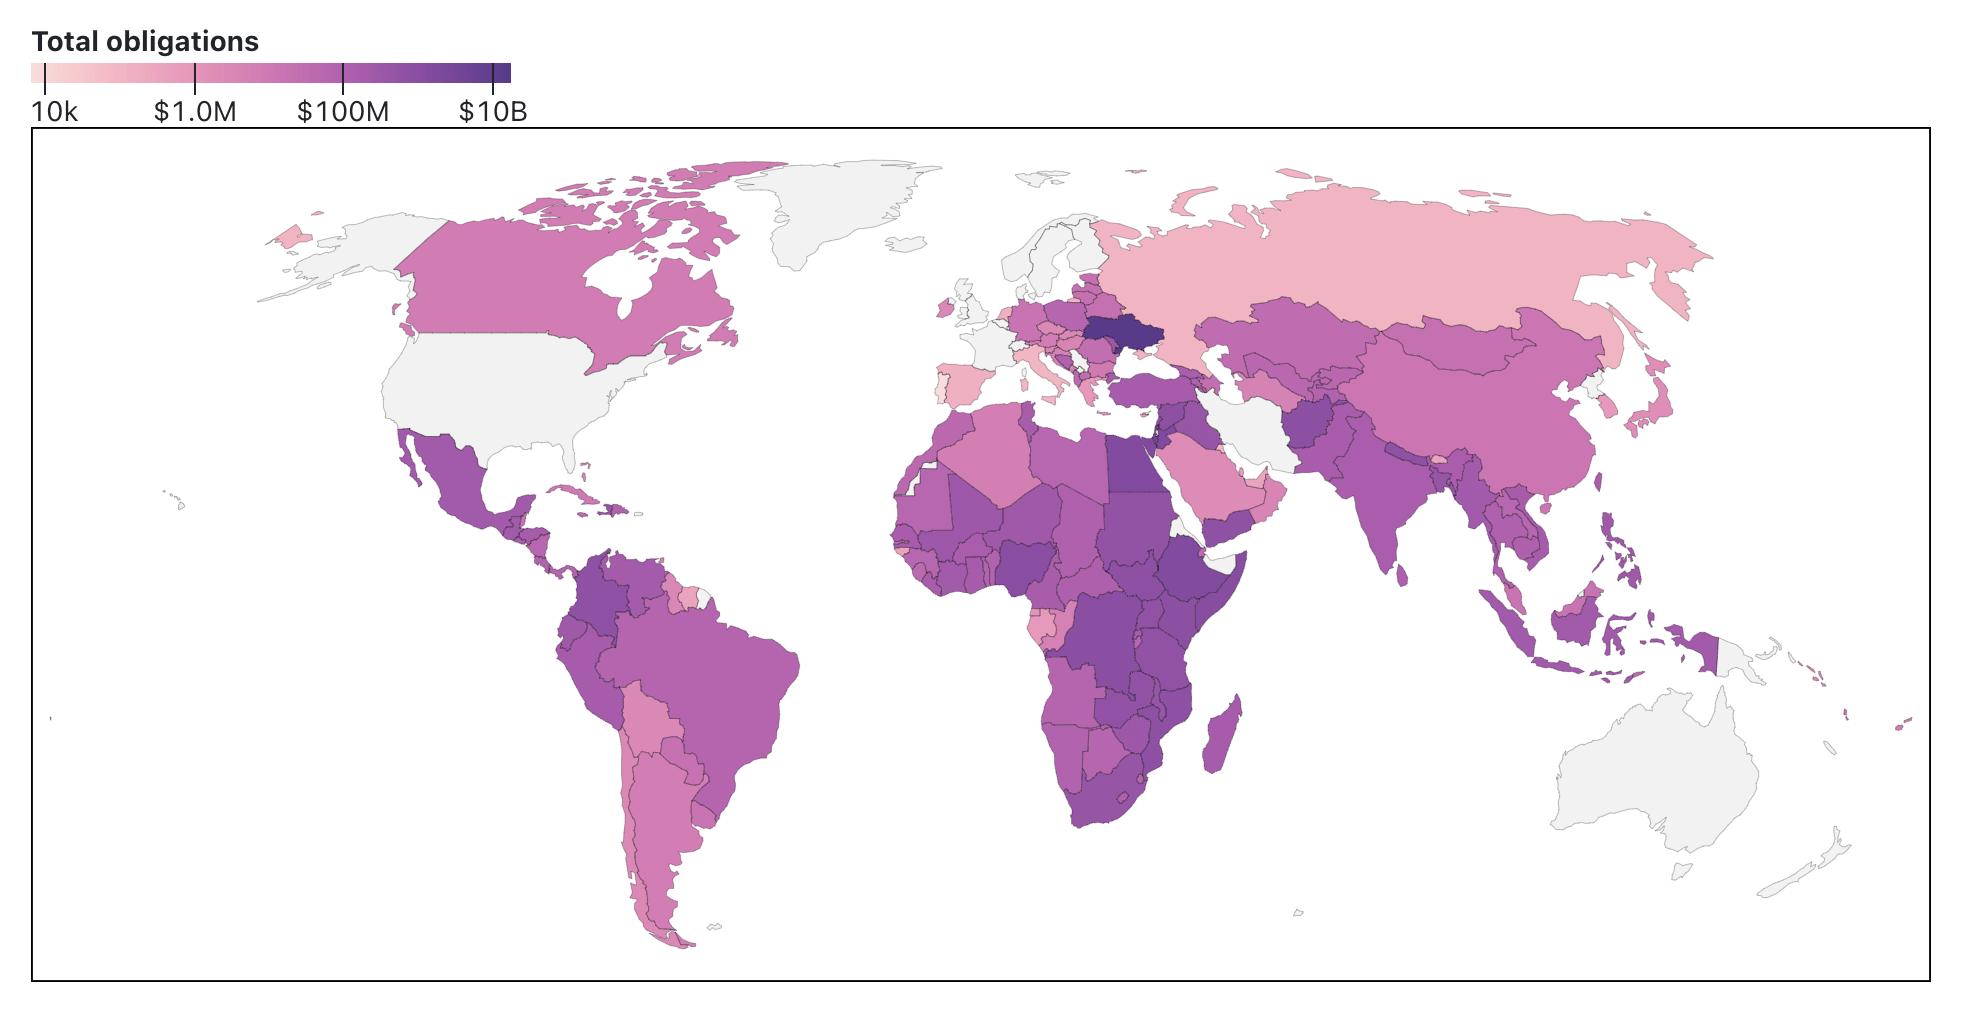
Land isn’t unemployed—people are. Here’s how to use R, {ggplot2}, {sf}, and {patchwork} to create a histogram legend in a choropleth map to better see the distribution of values.
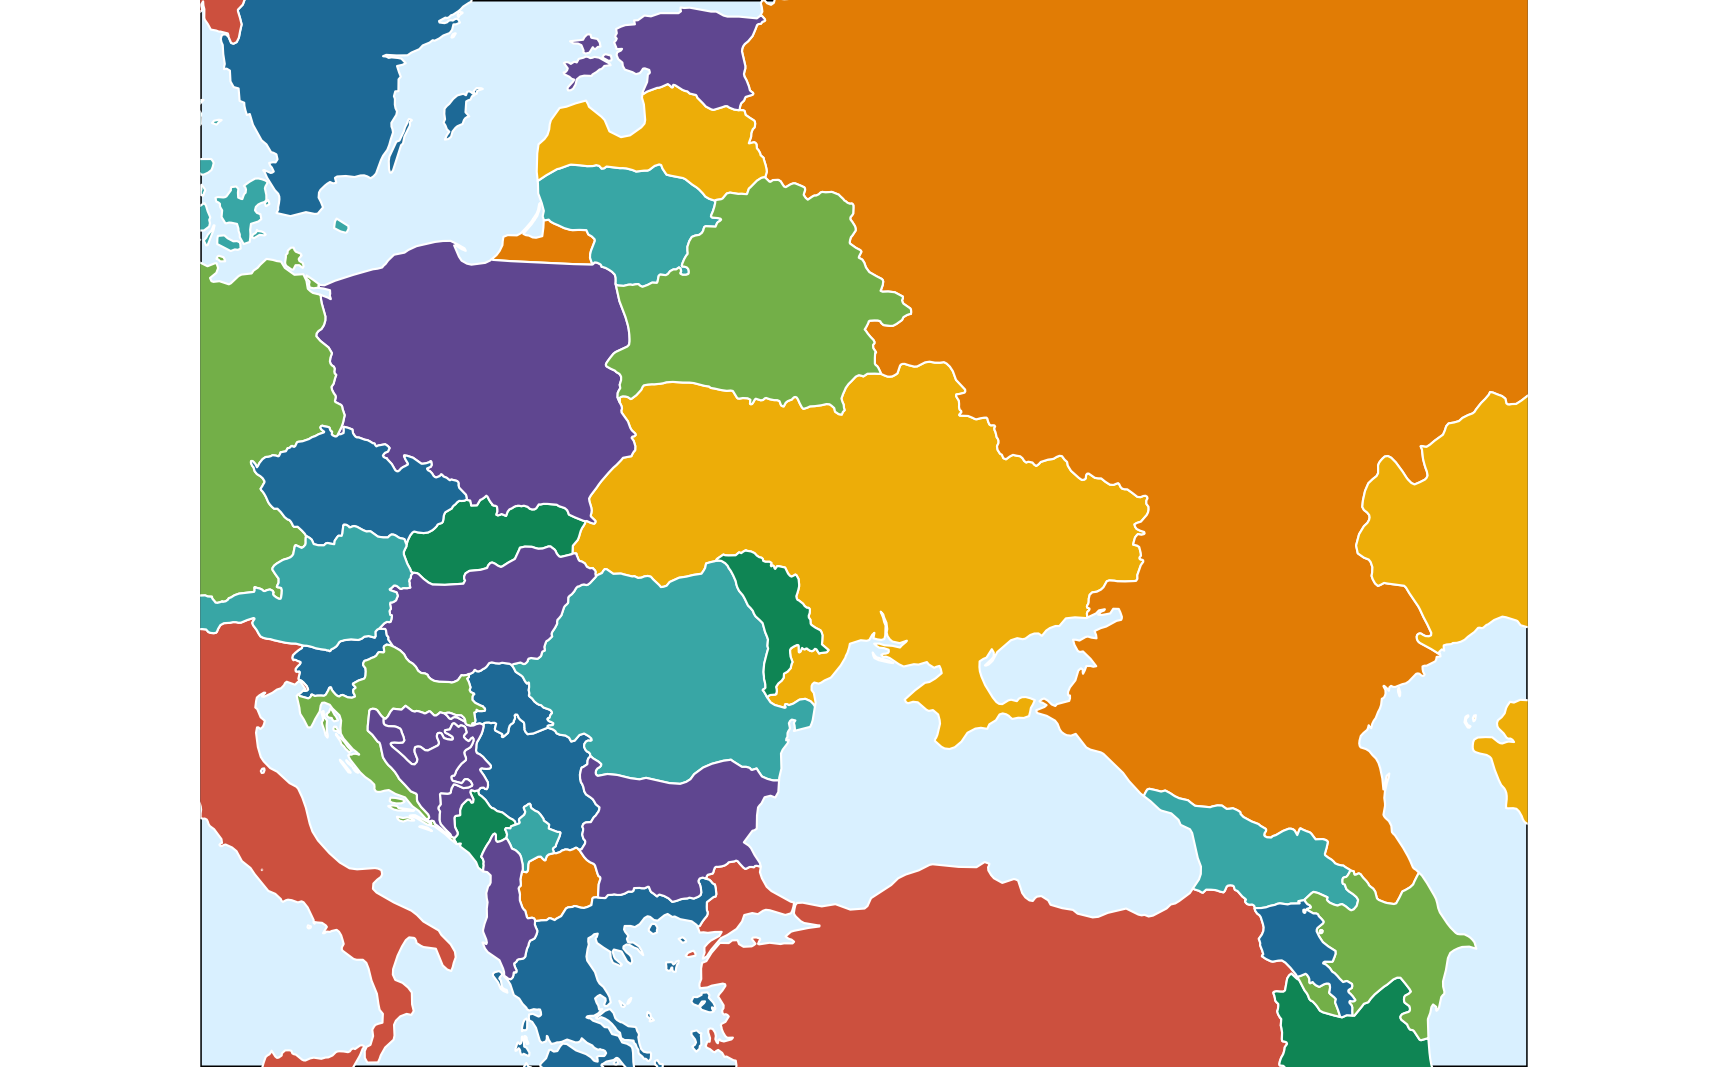
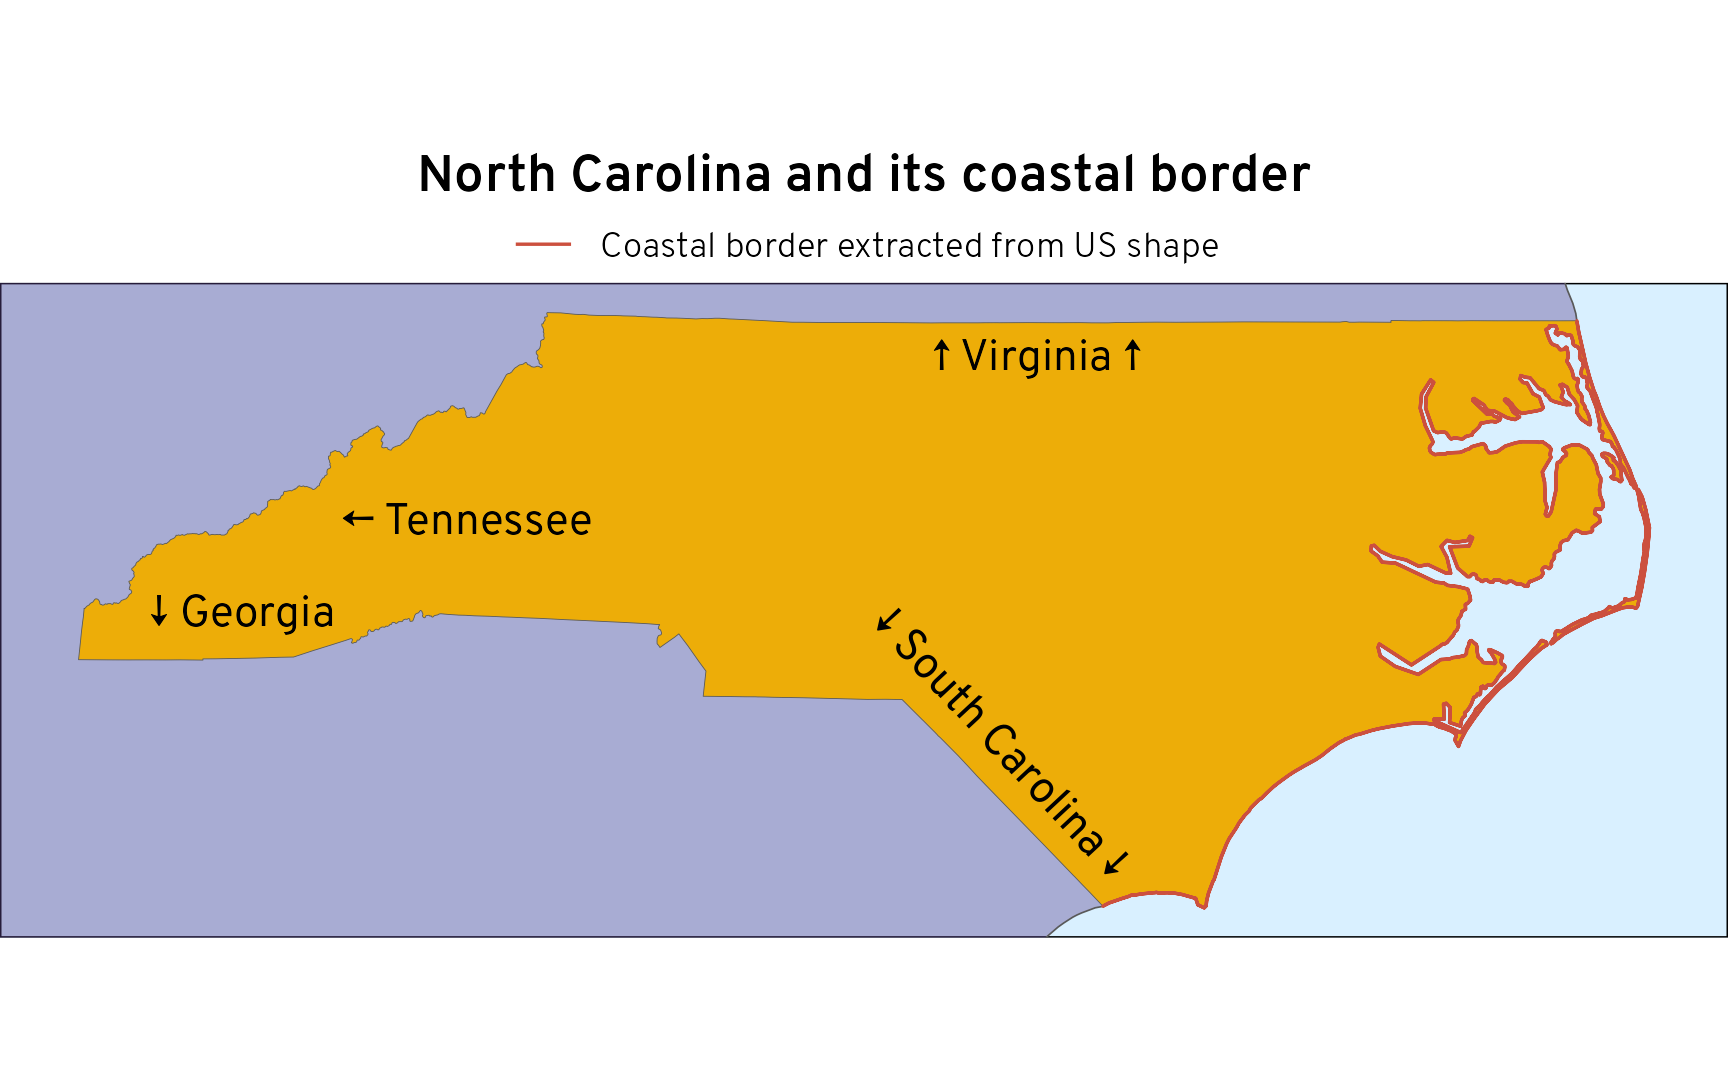
Natural Earth’s de facto on-the-ground policy conflicts with de jure boundaries. Use {sf} and R to relocate parts of country shapes.
Manipulate geographic data, change projections, get live data from a database, and make interactive plots with Observable JS
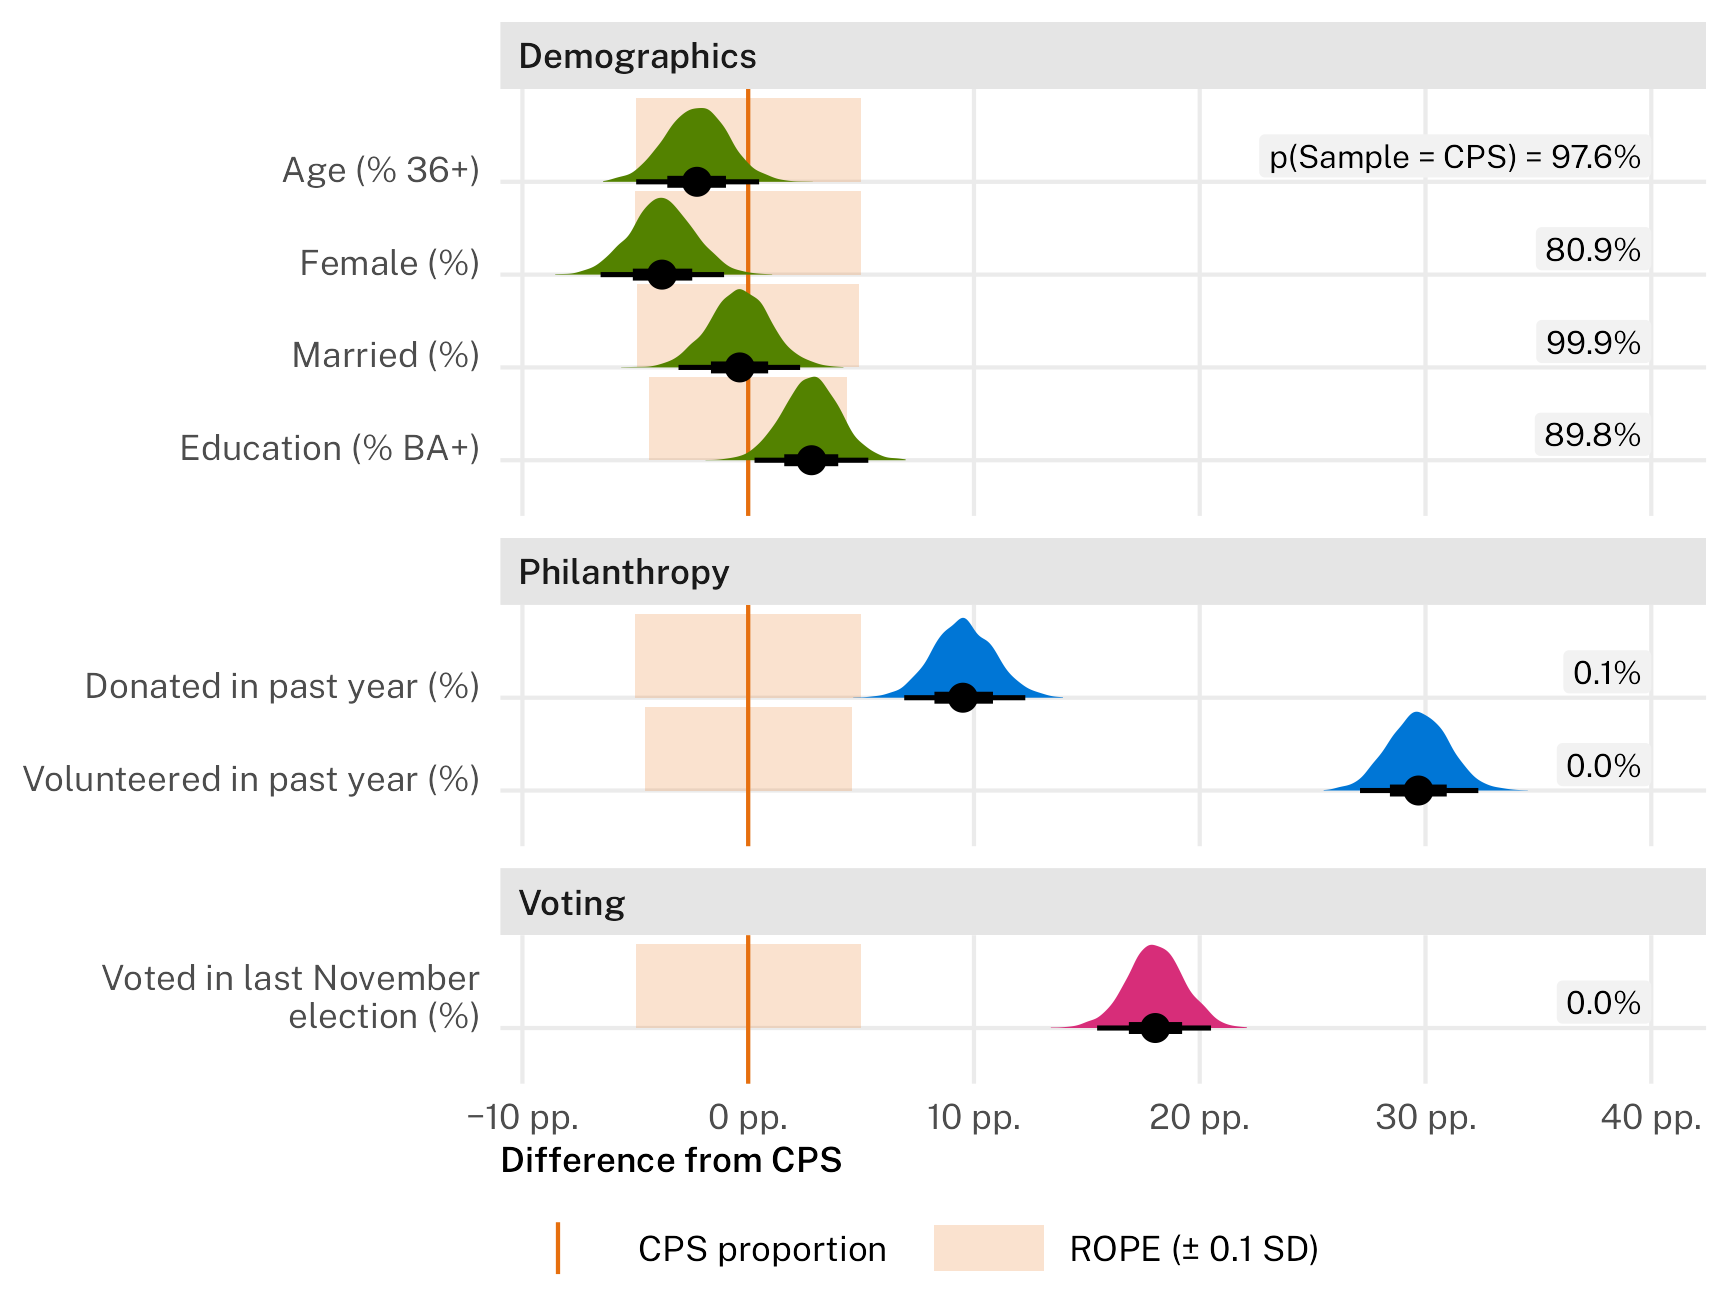
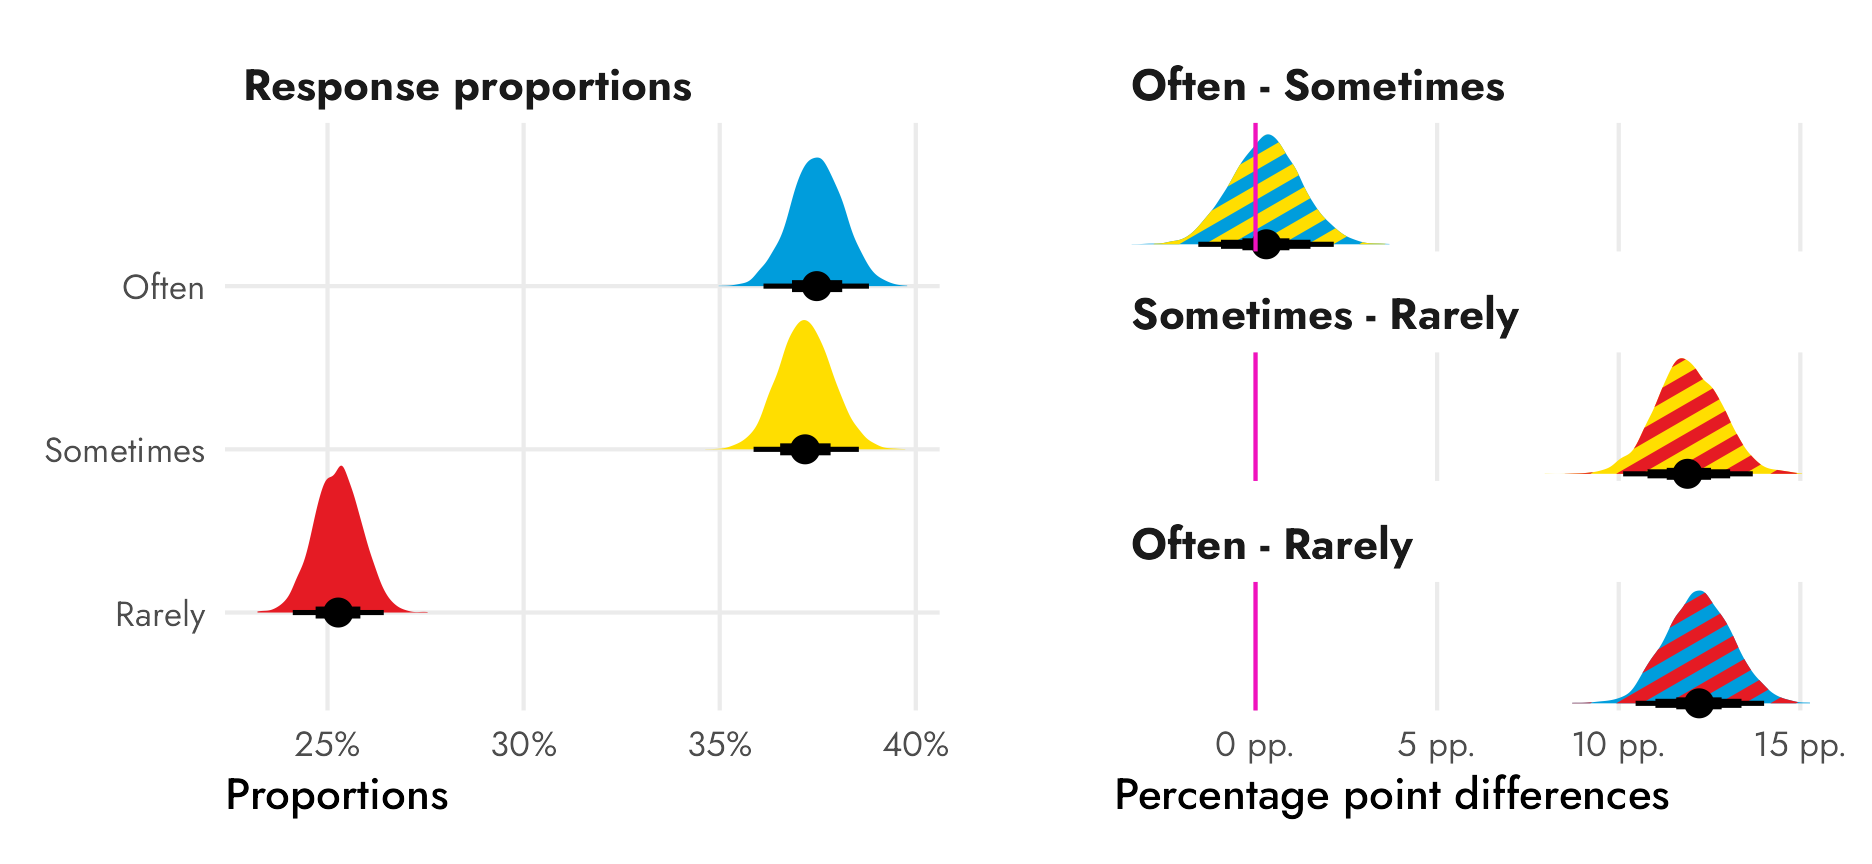
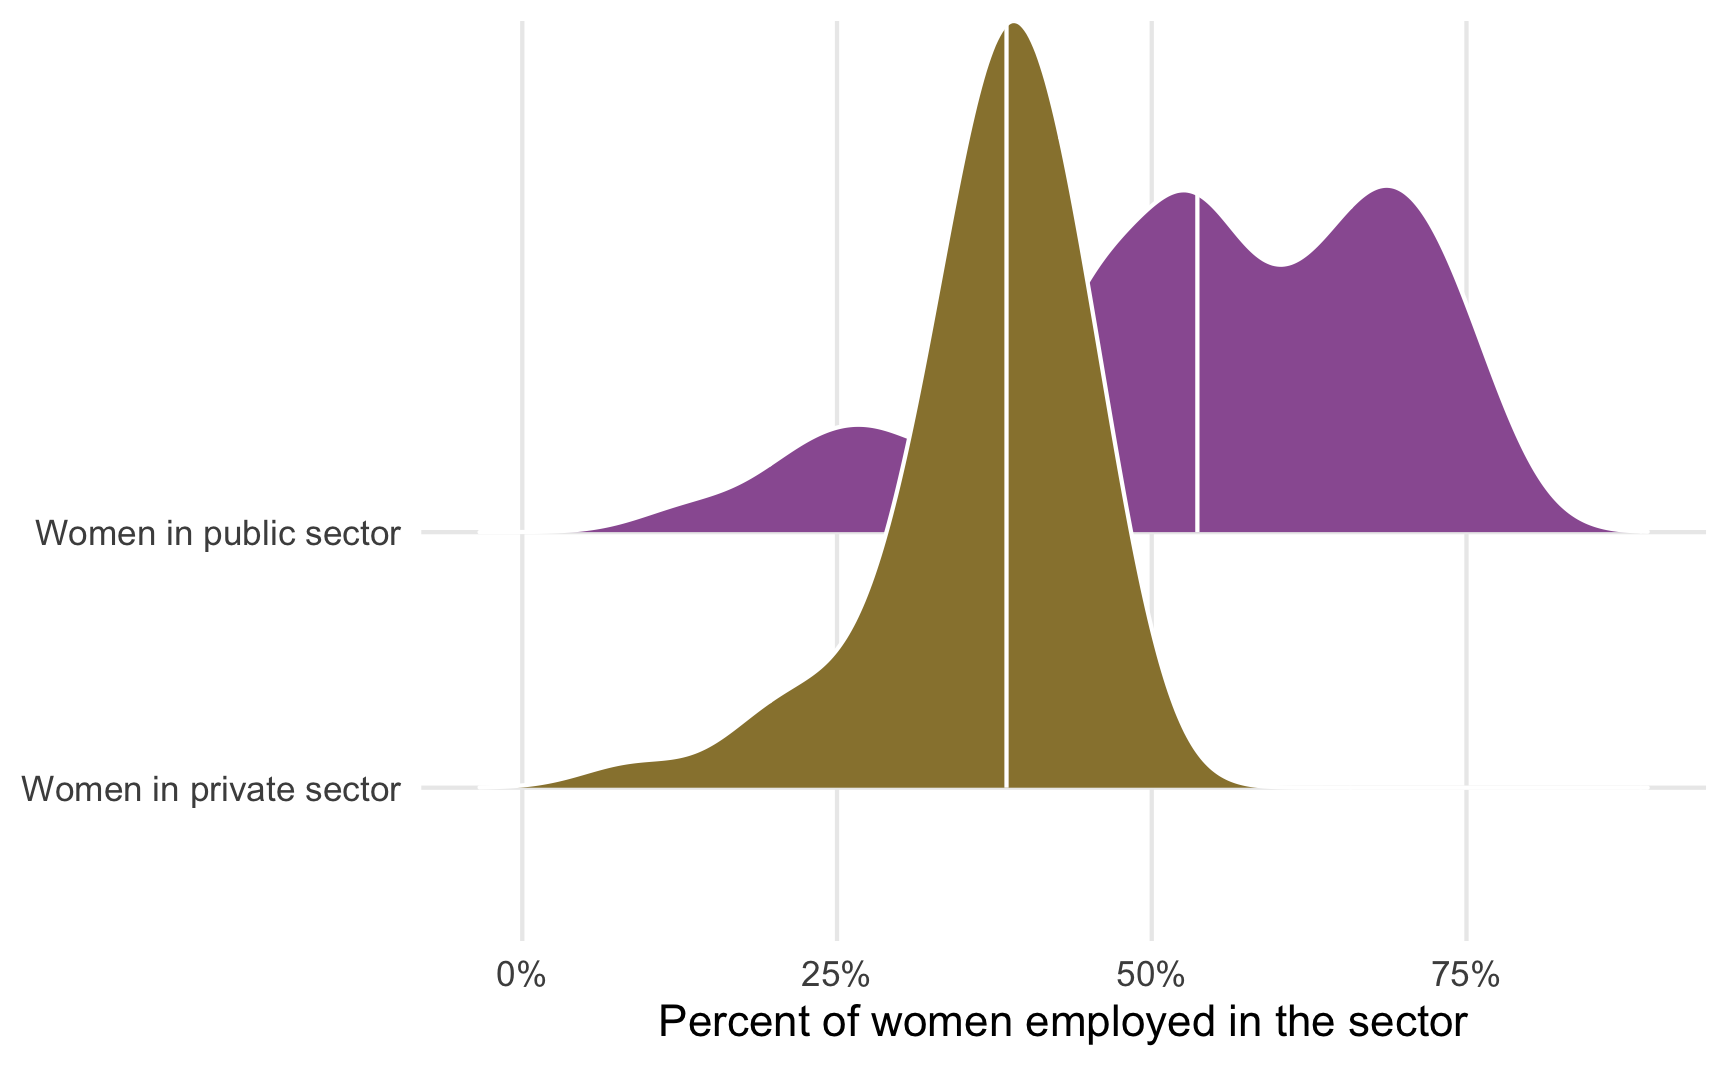
Download CPS demographic data from IPUMS and use R and {brms} to calculate differences between sample and national proportions with Bayesian ROPE-based inference
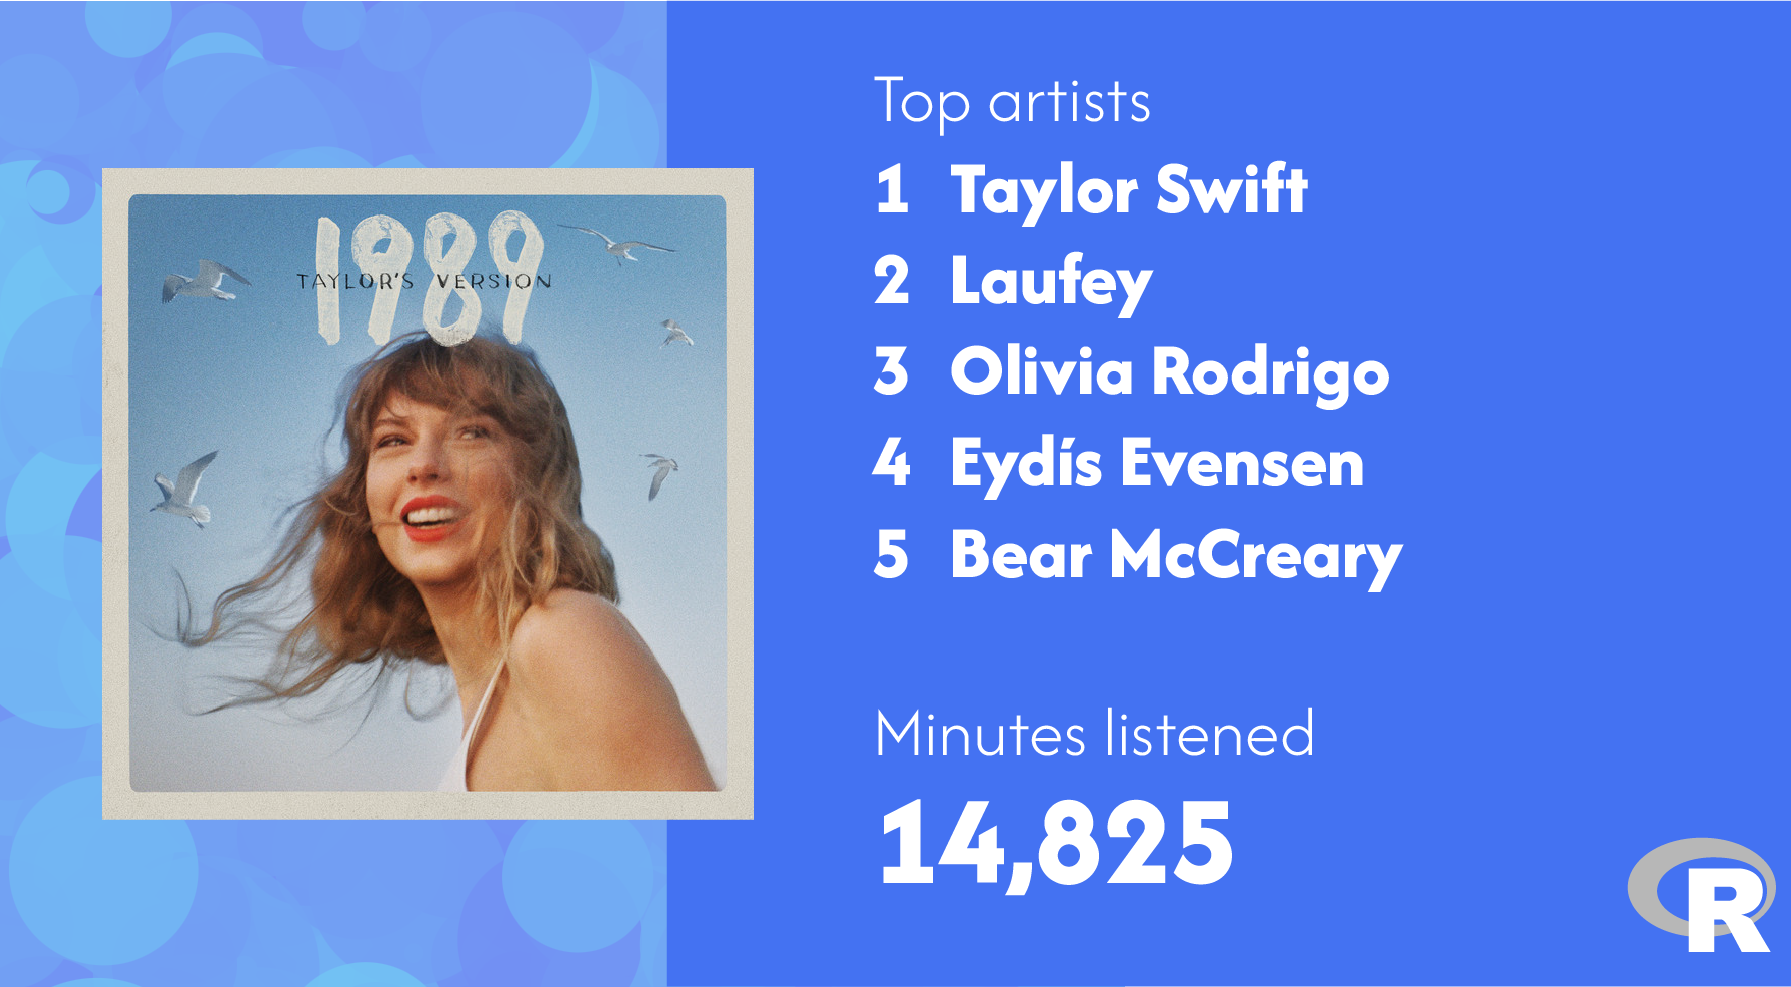
Use R to parse Apple Music XML files and create your own Spotify Wrapped-like stats
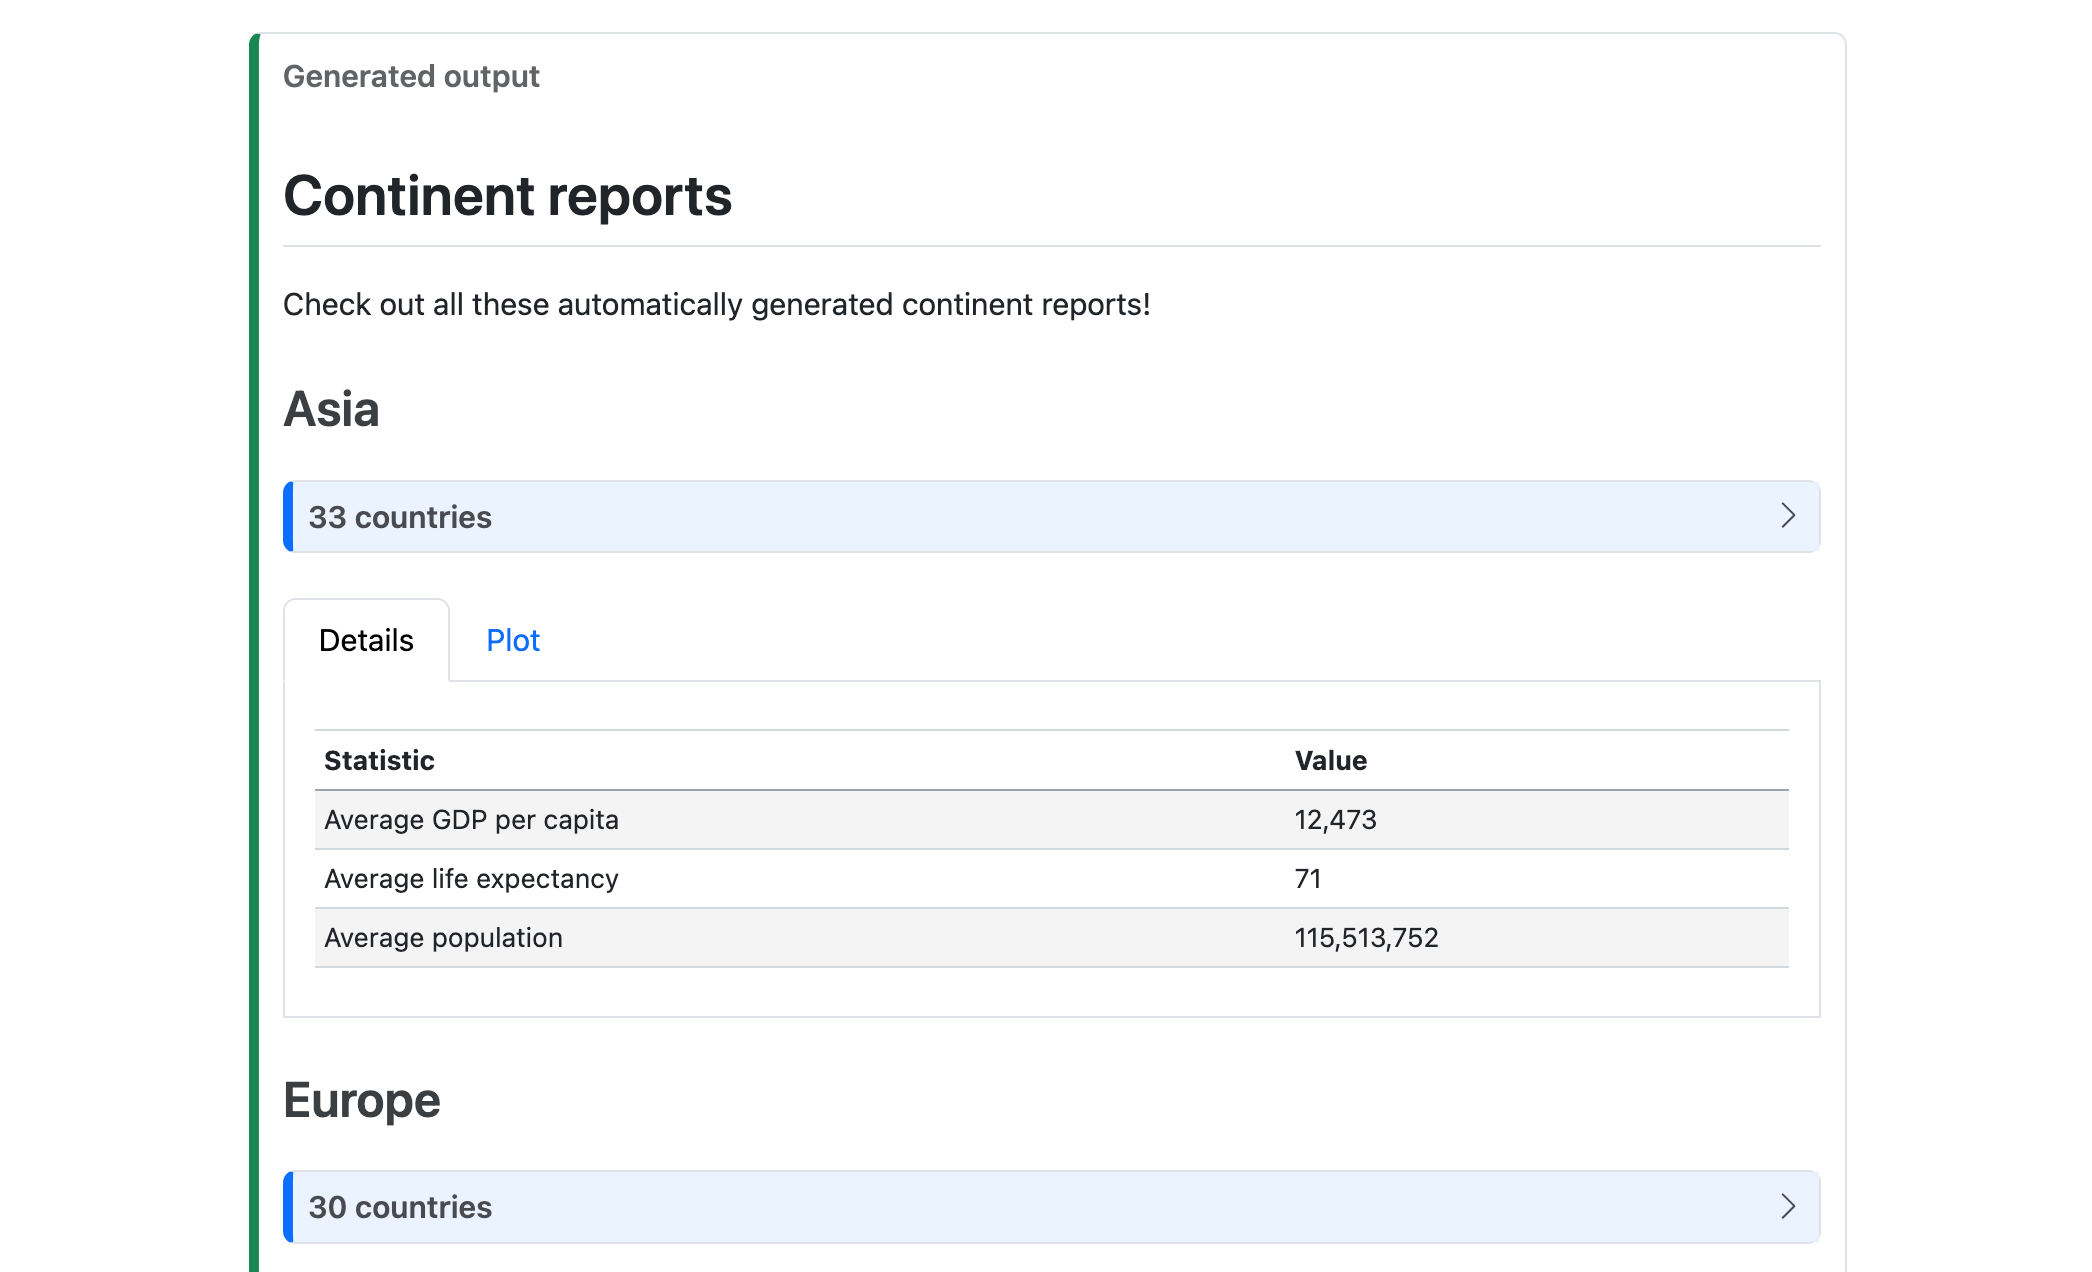
Learn how to use knitr::knit() in inline chunks to correctly render auto-generated R and markdown content in Quarto documents
knitr::knit()
Combine the best of RStudio and Visual Studio Code in Posit’s new Positron IDE
Measuring coastlines is hard and causes fractal paradoxes, but we can use R and {sf} to try!
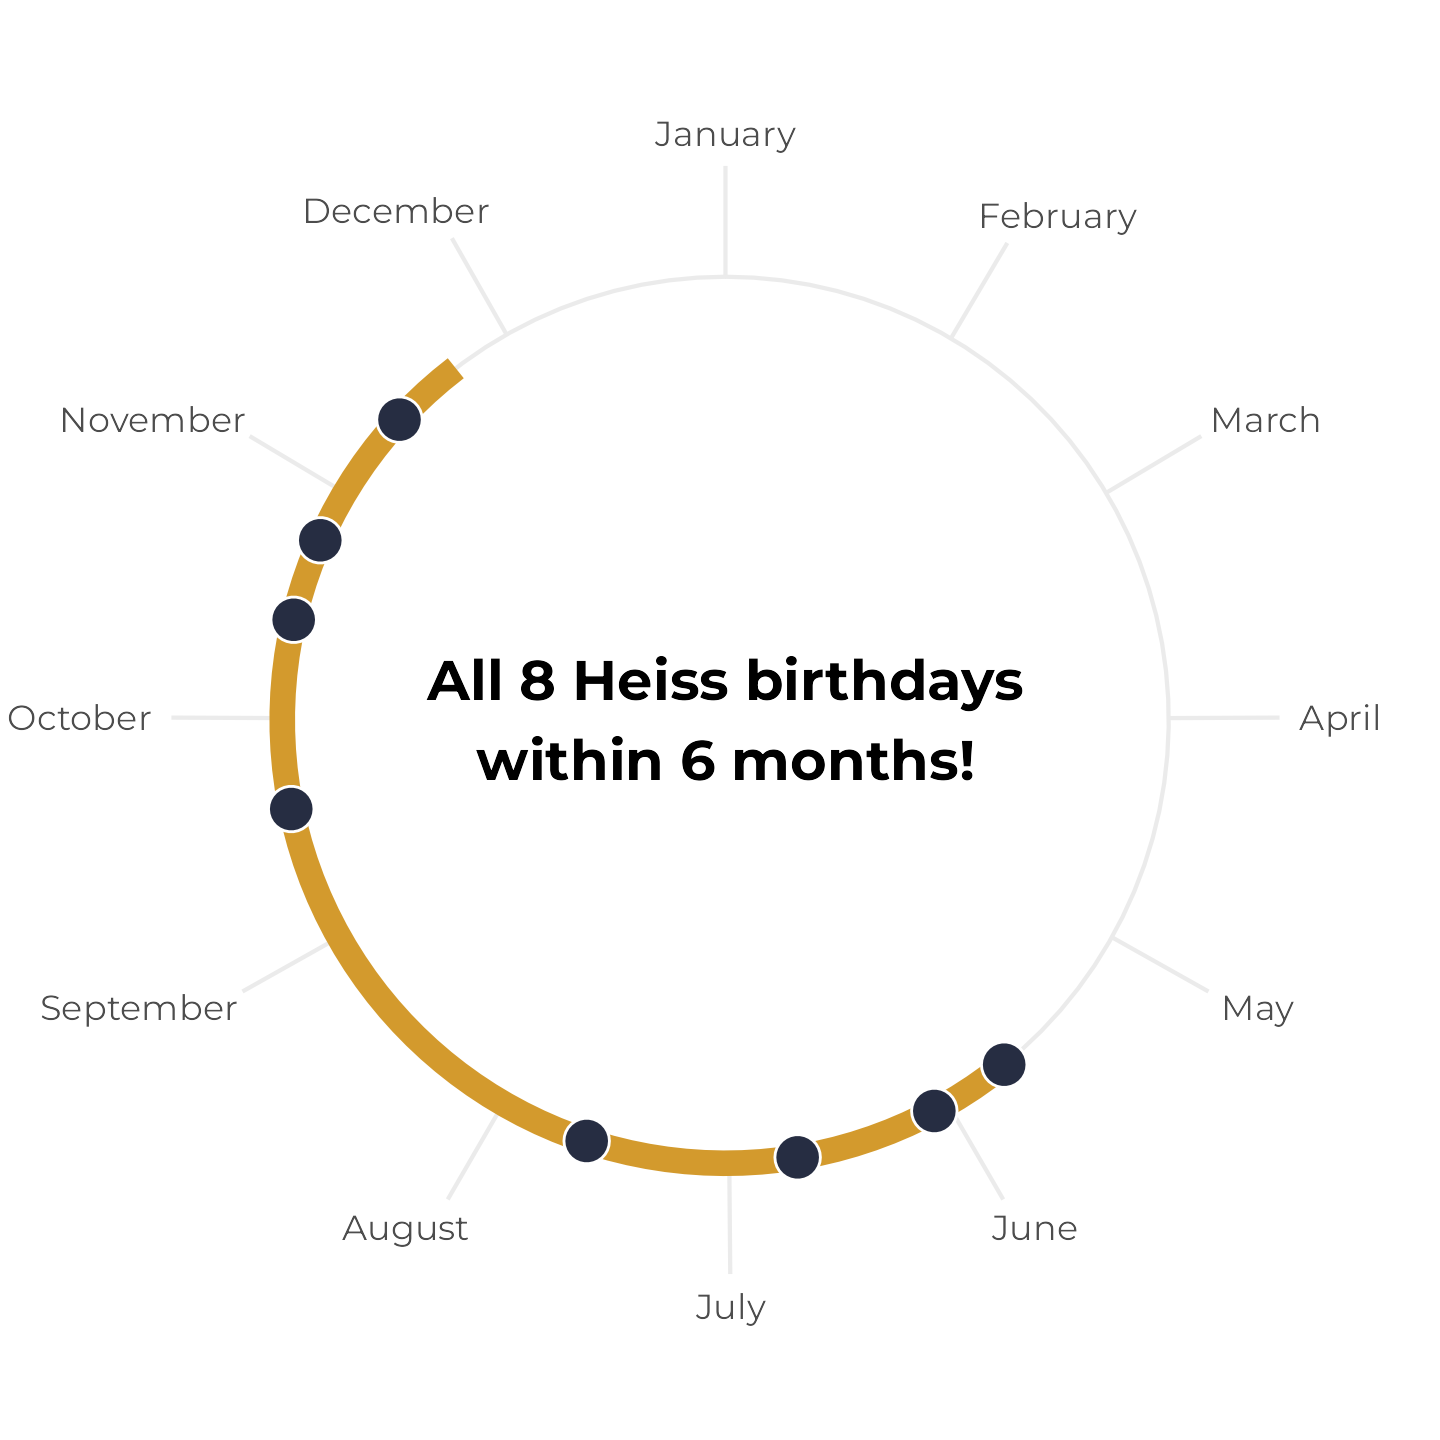
Probability math is hard. Use brute force simulation to find the probability that a household has a cluster of birthdays.
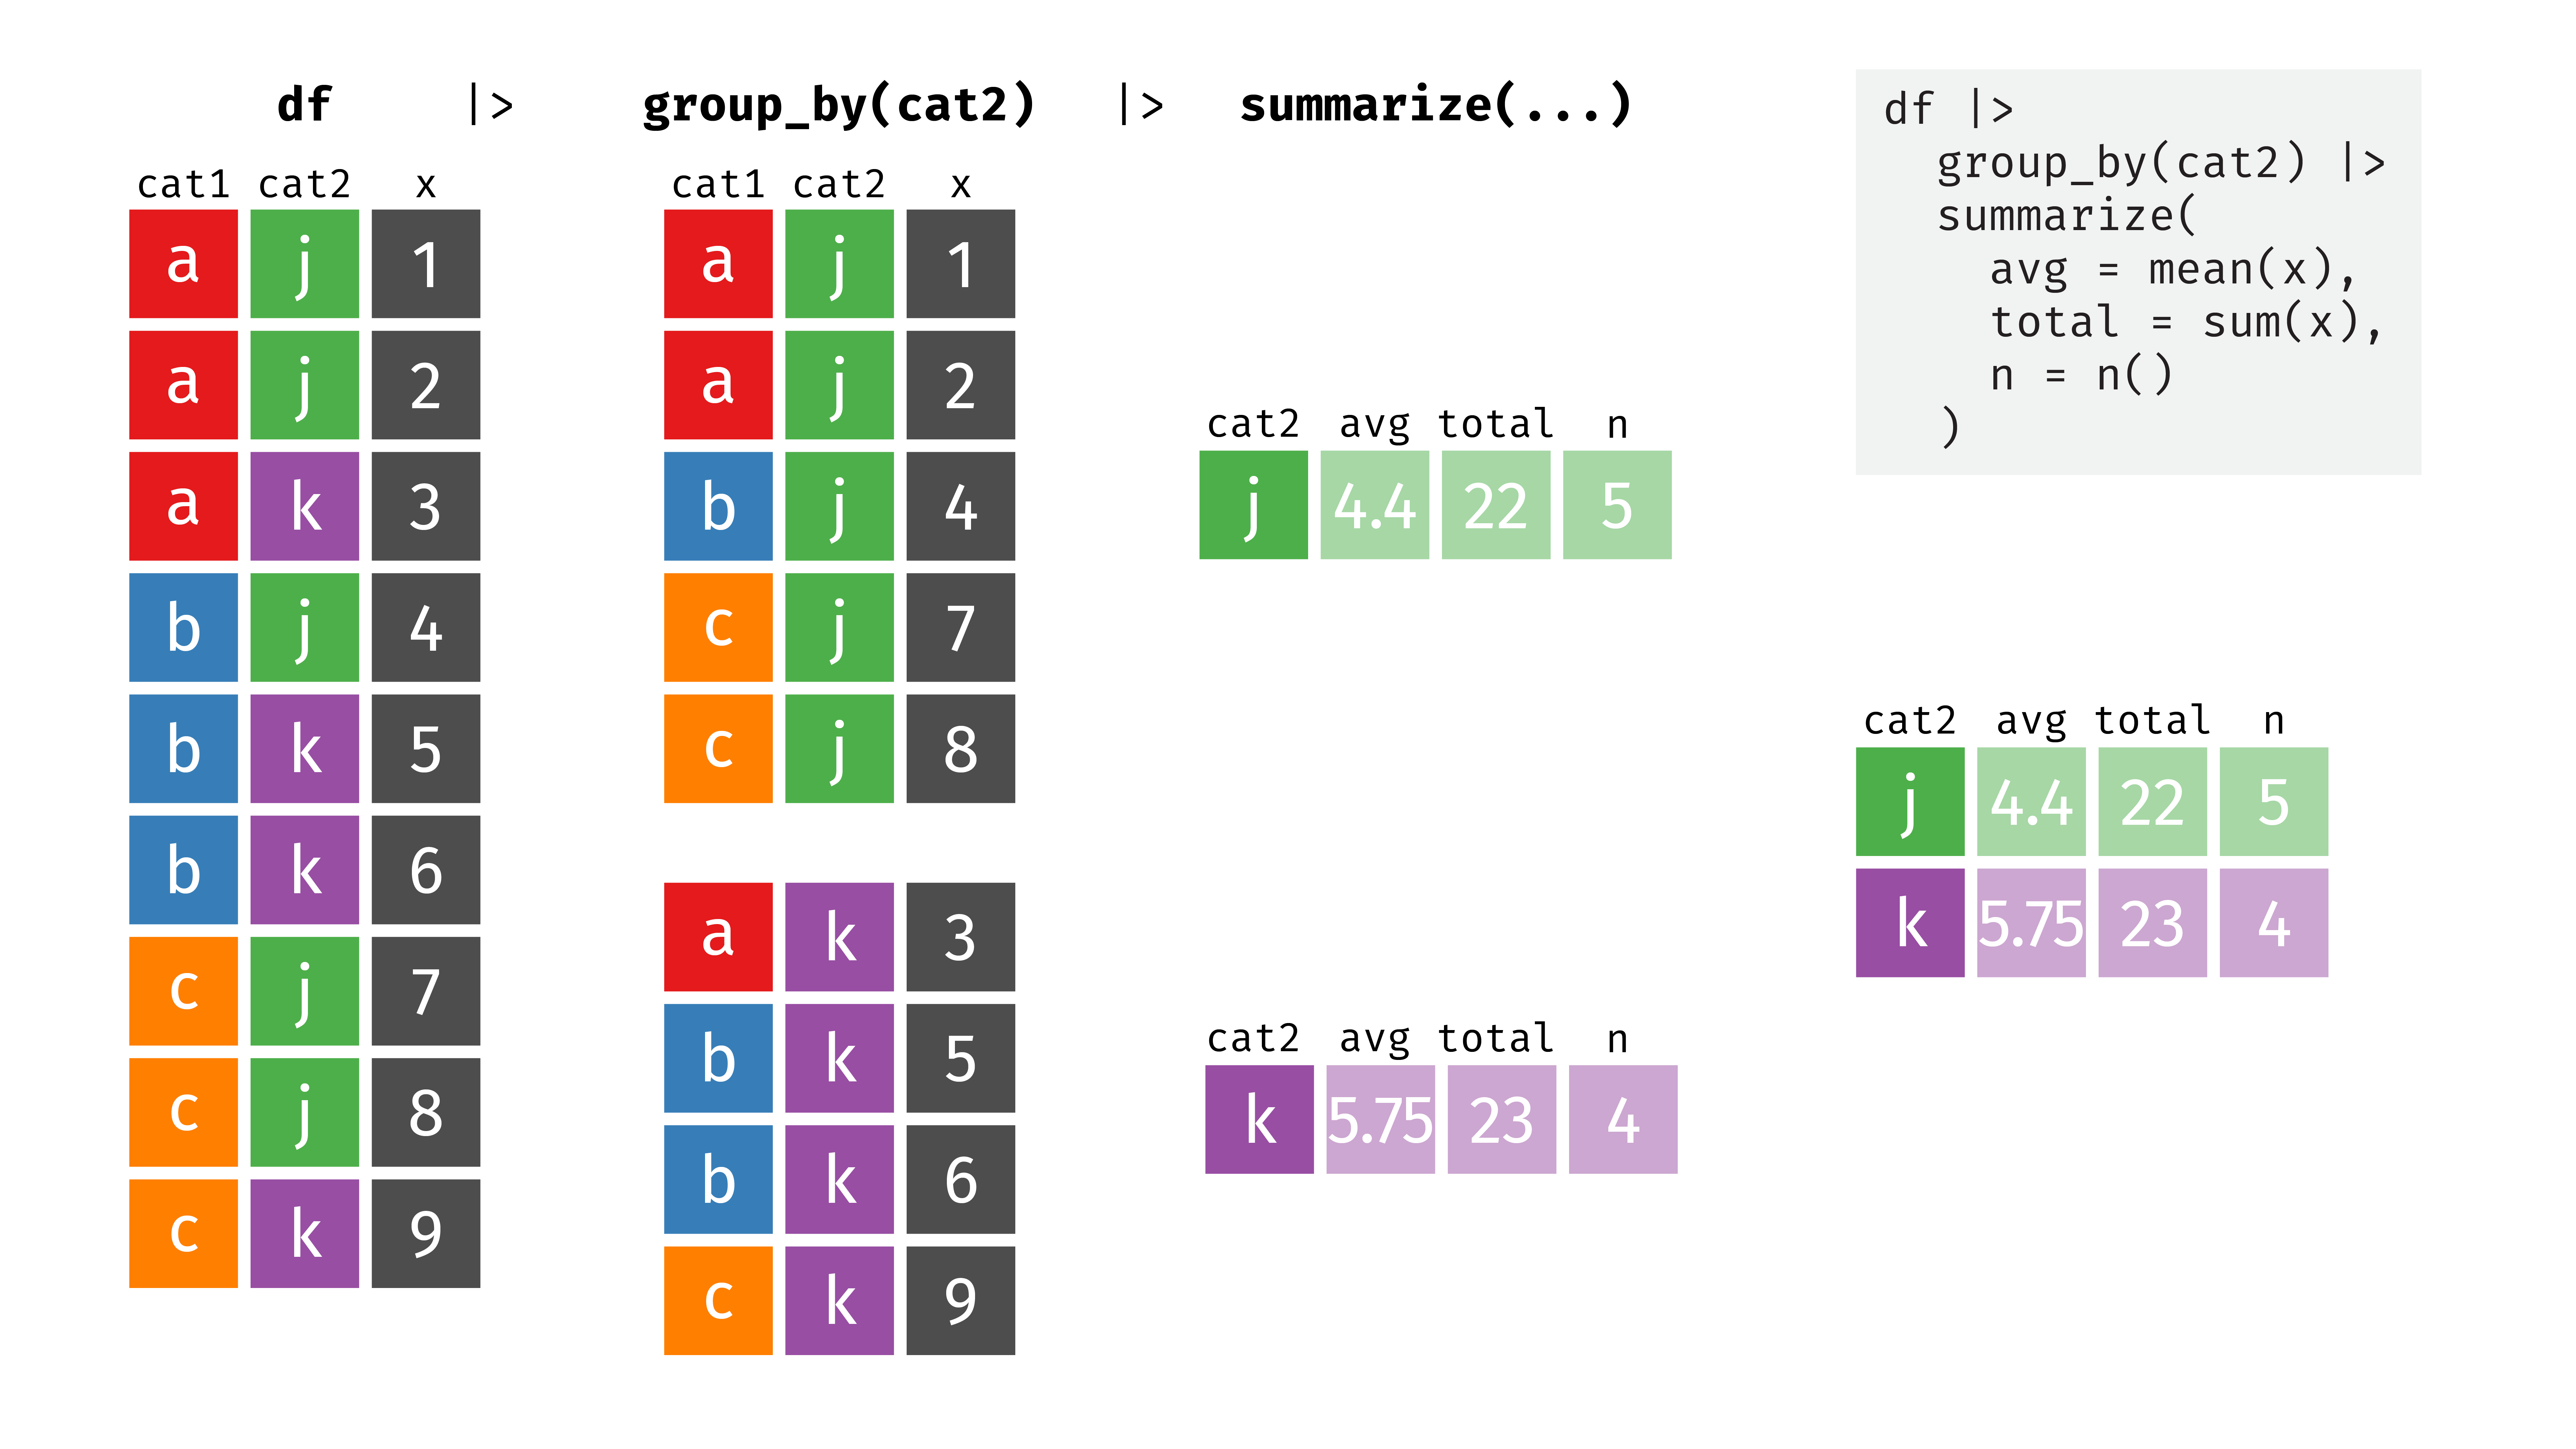
Visually explore how {dplyr}’s more complex core functions work together to wrangle data
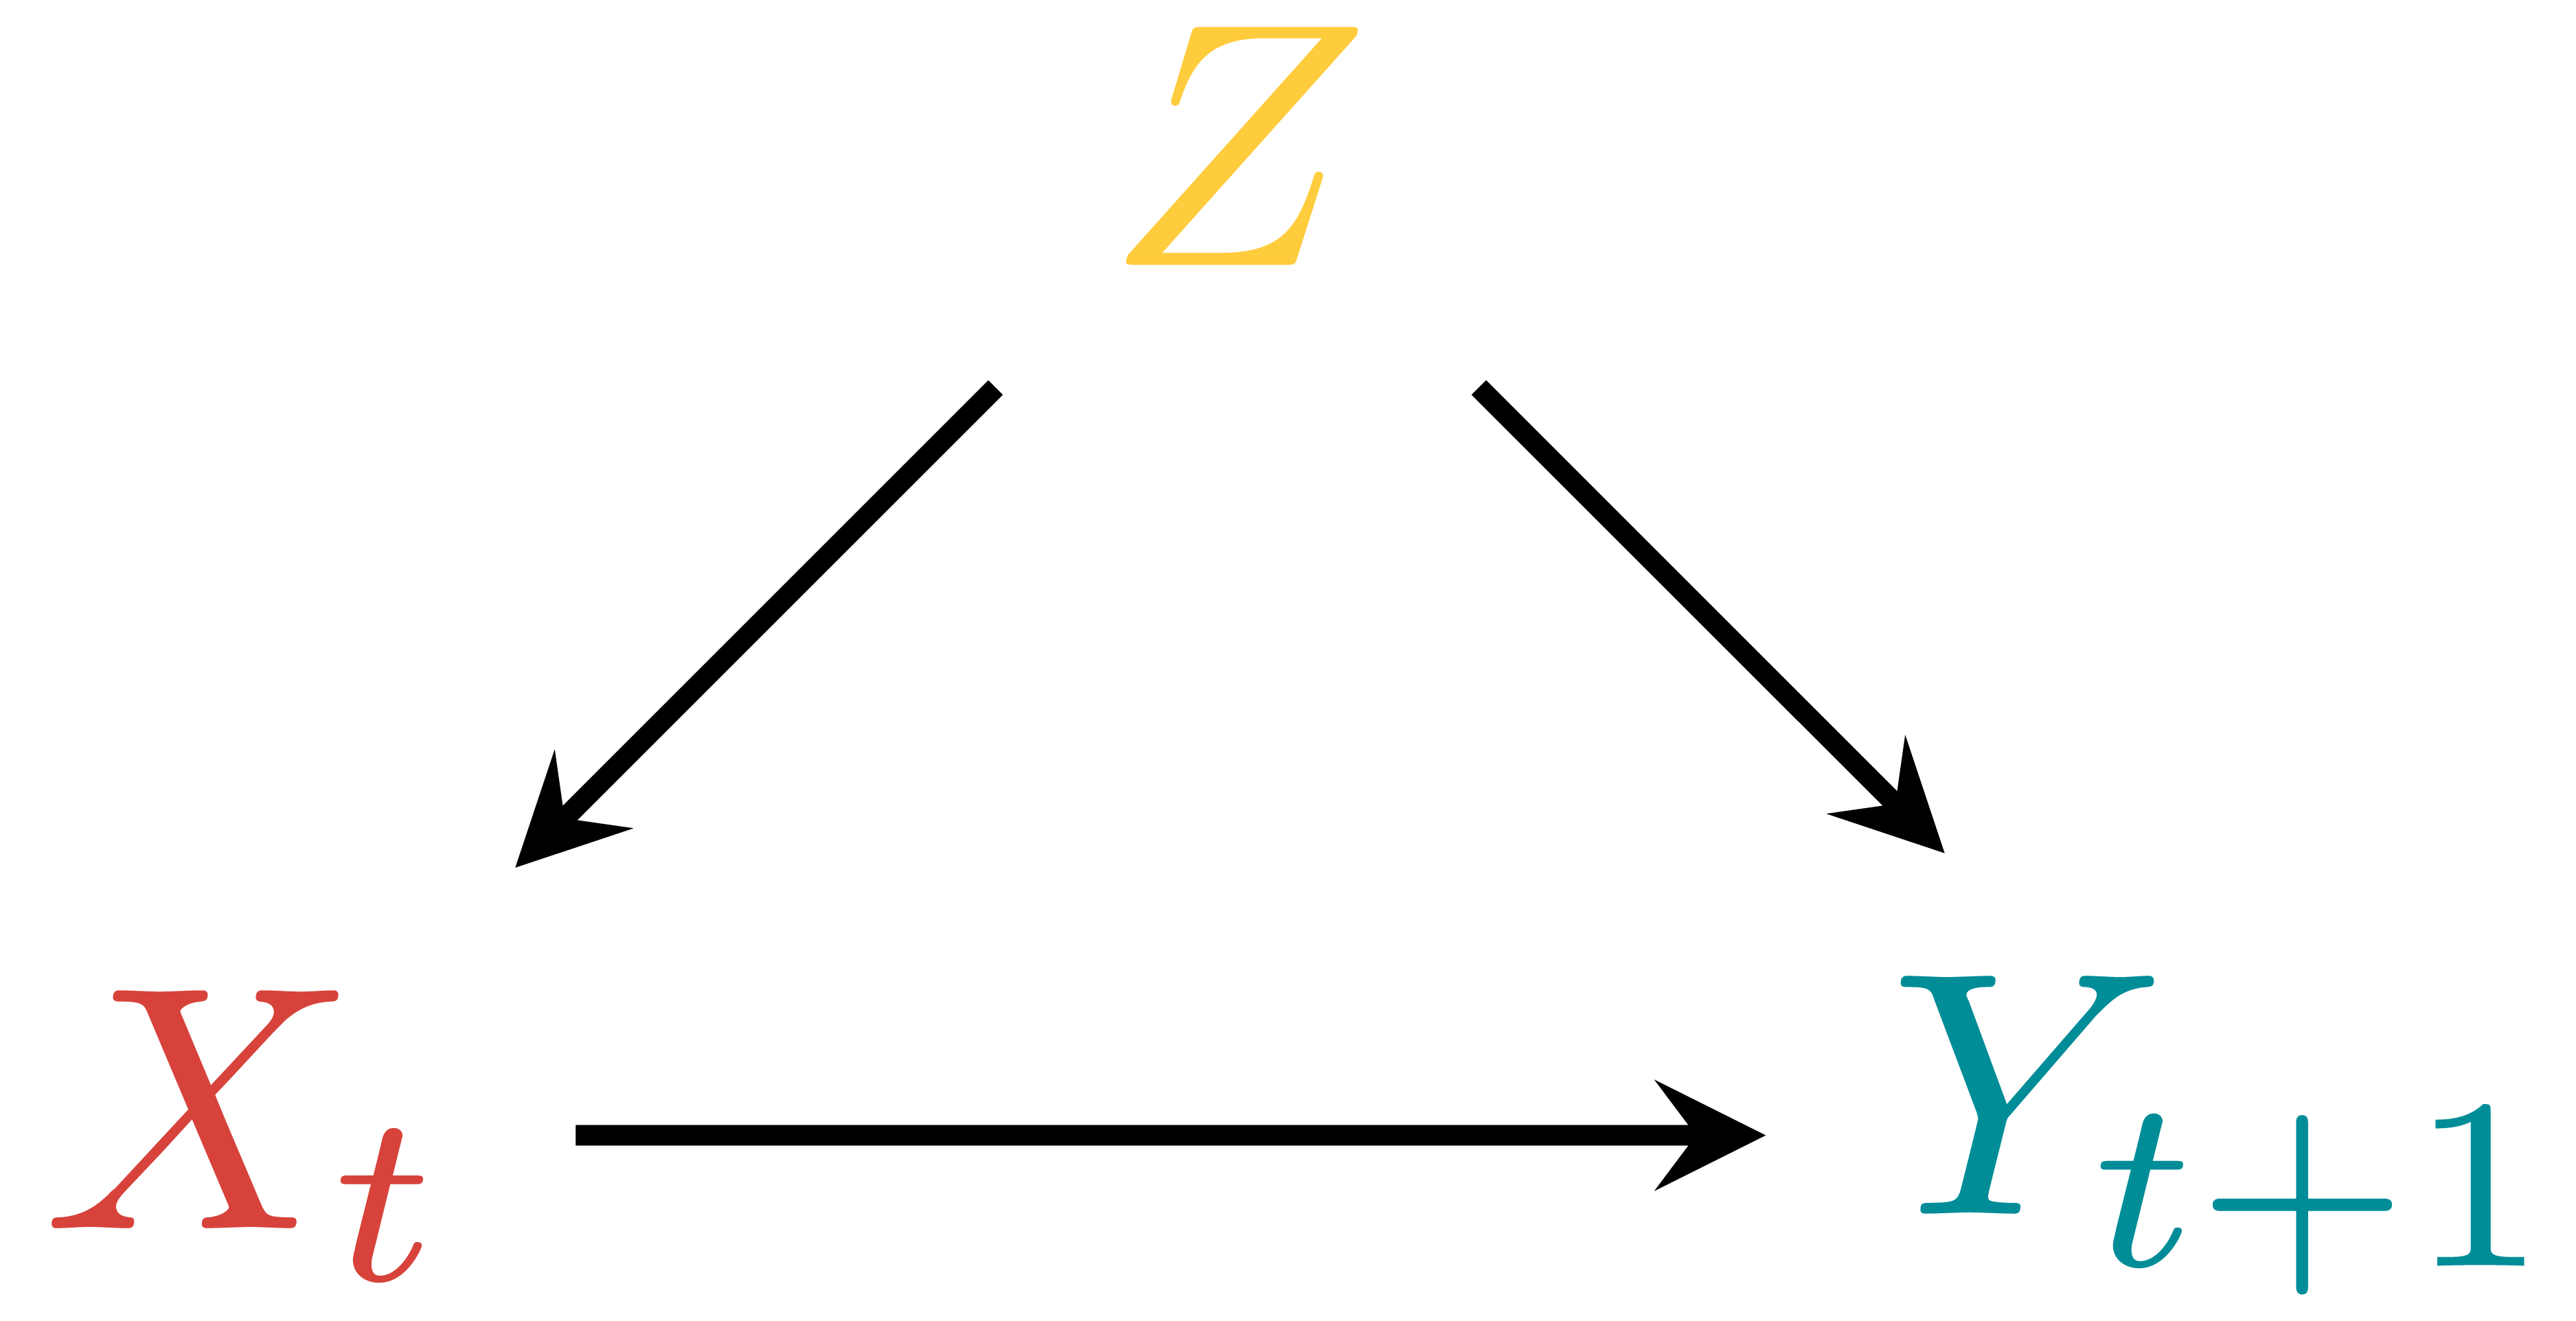
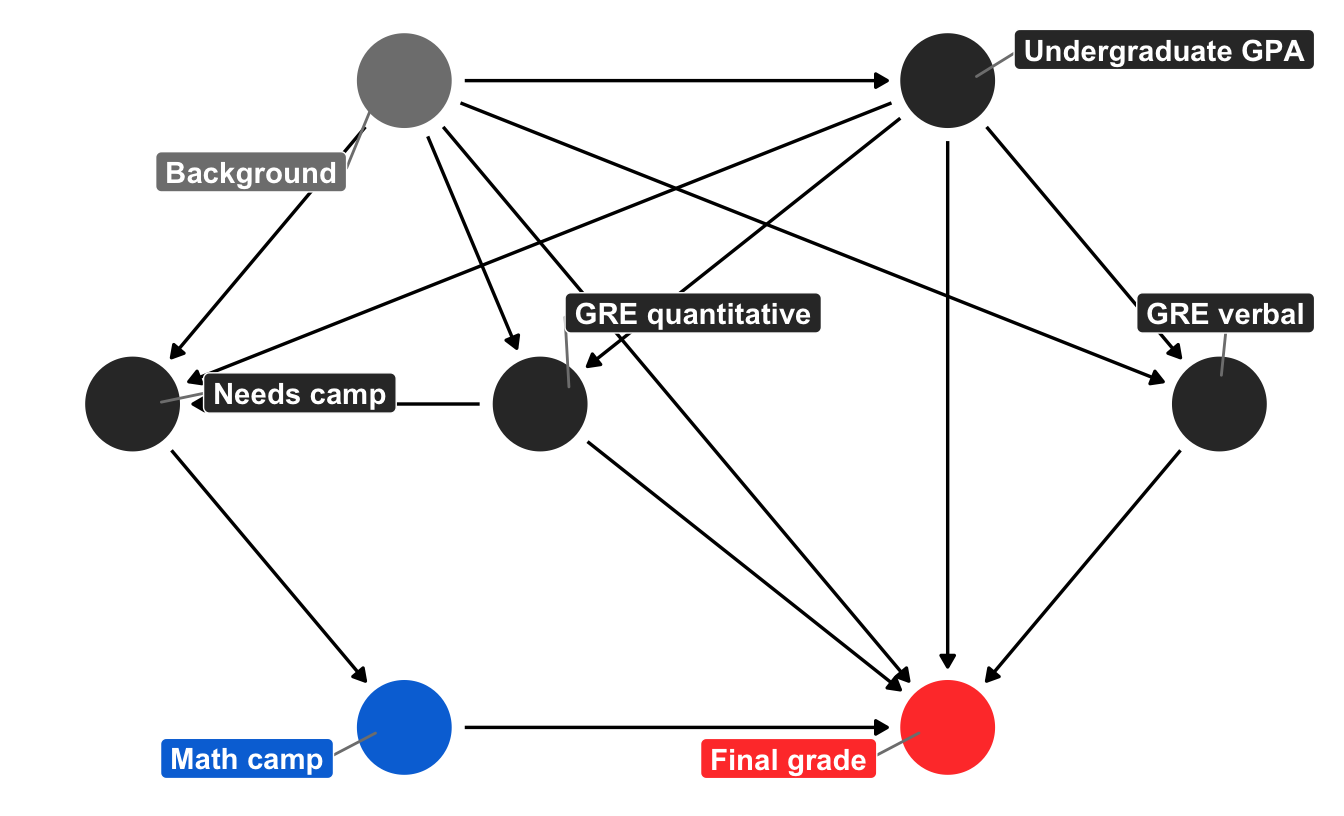
Explore why we care about the ATE, ATT, and ATU and figure out how to calculate them with observational data
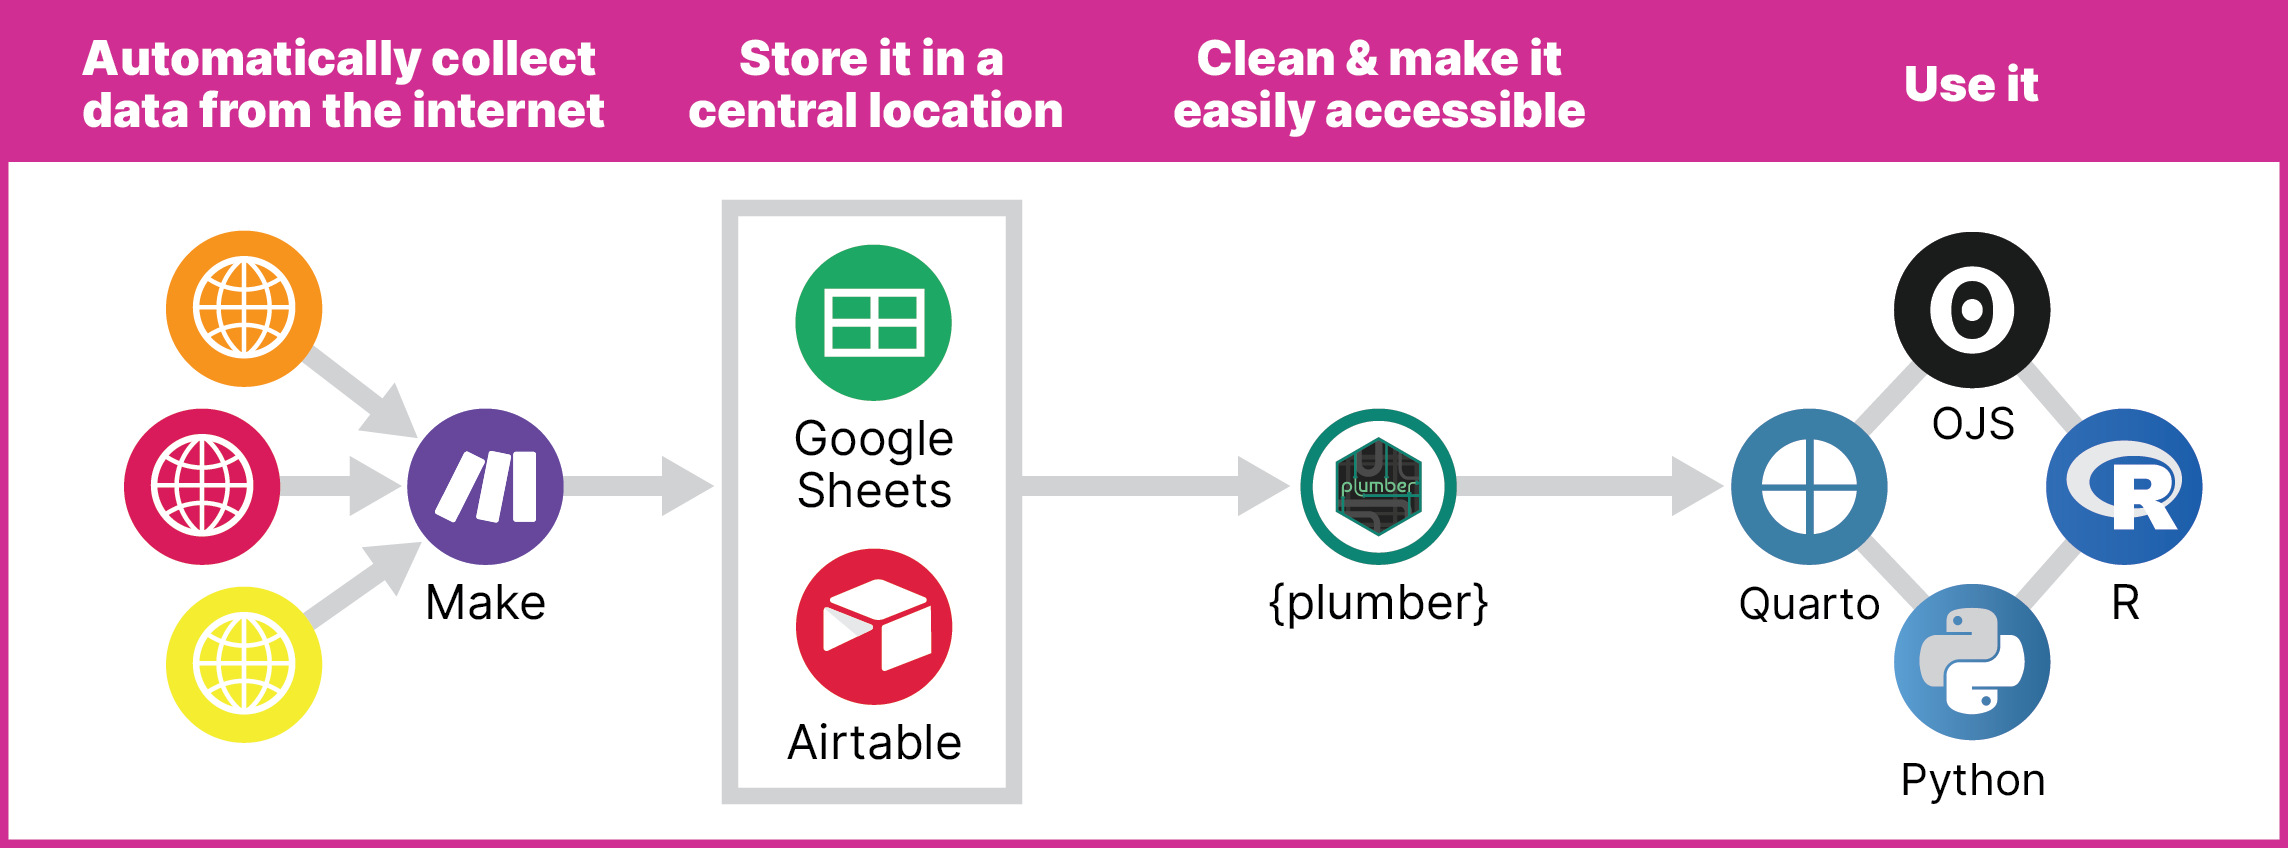
Use Make and {plumber} to create your own API and show live data in Quarto with R and Observable JS
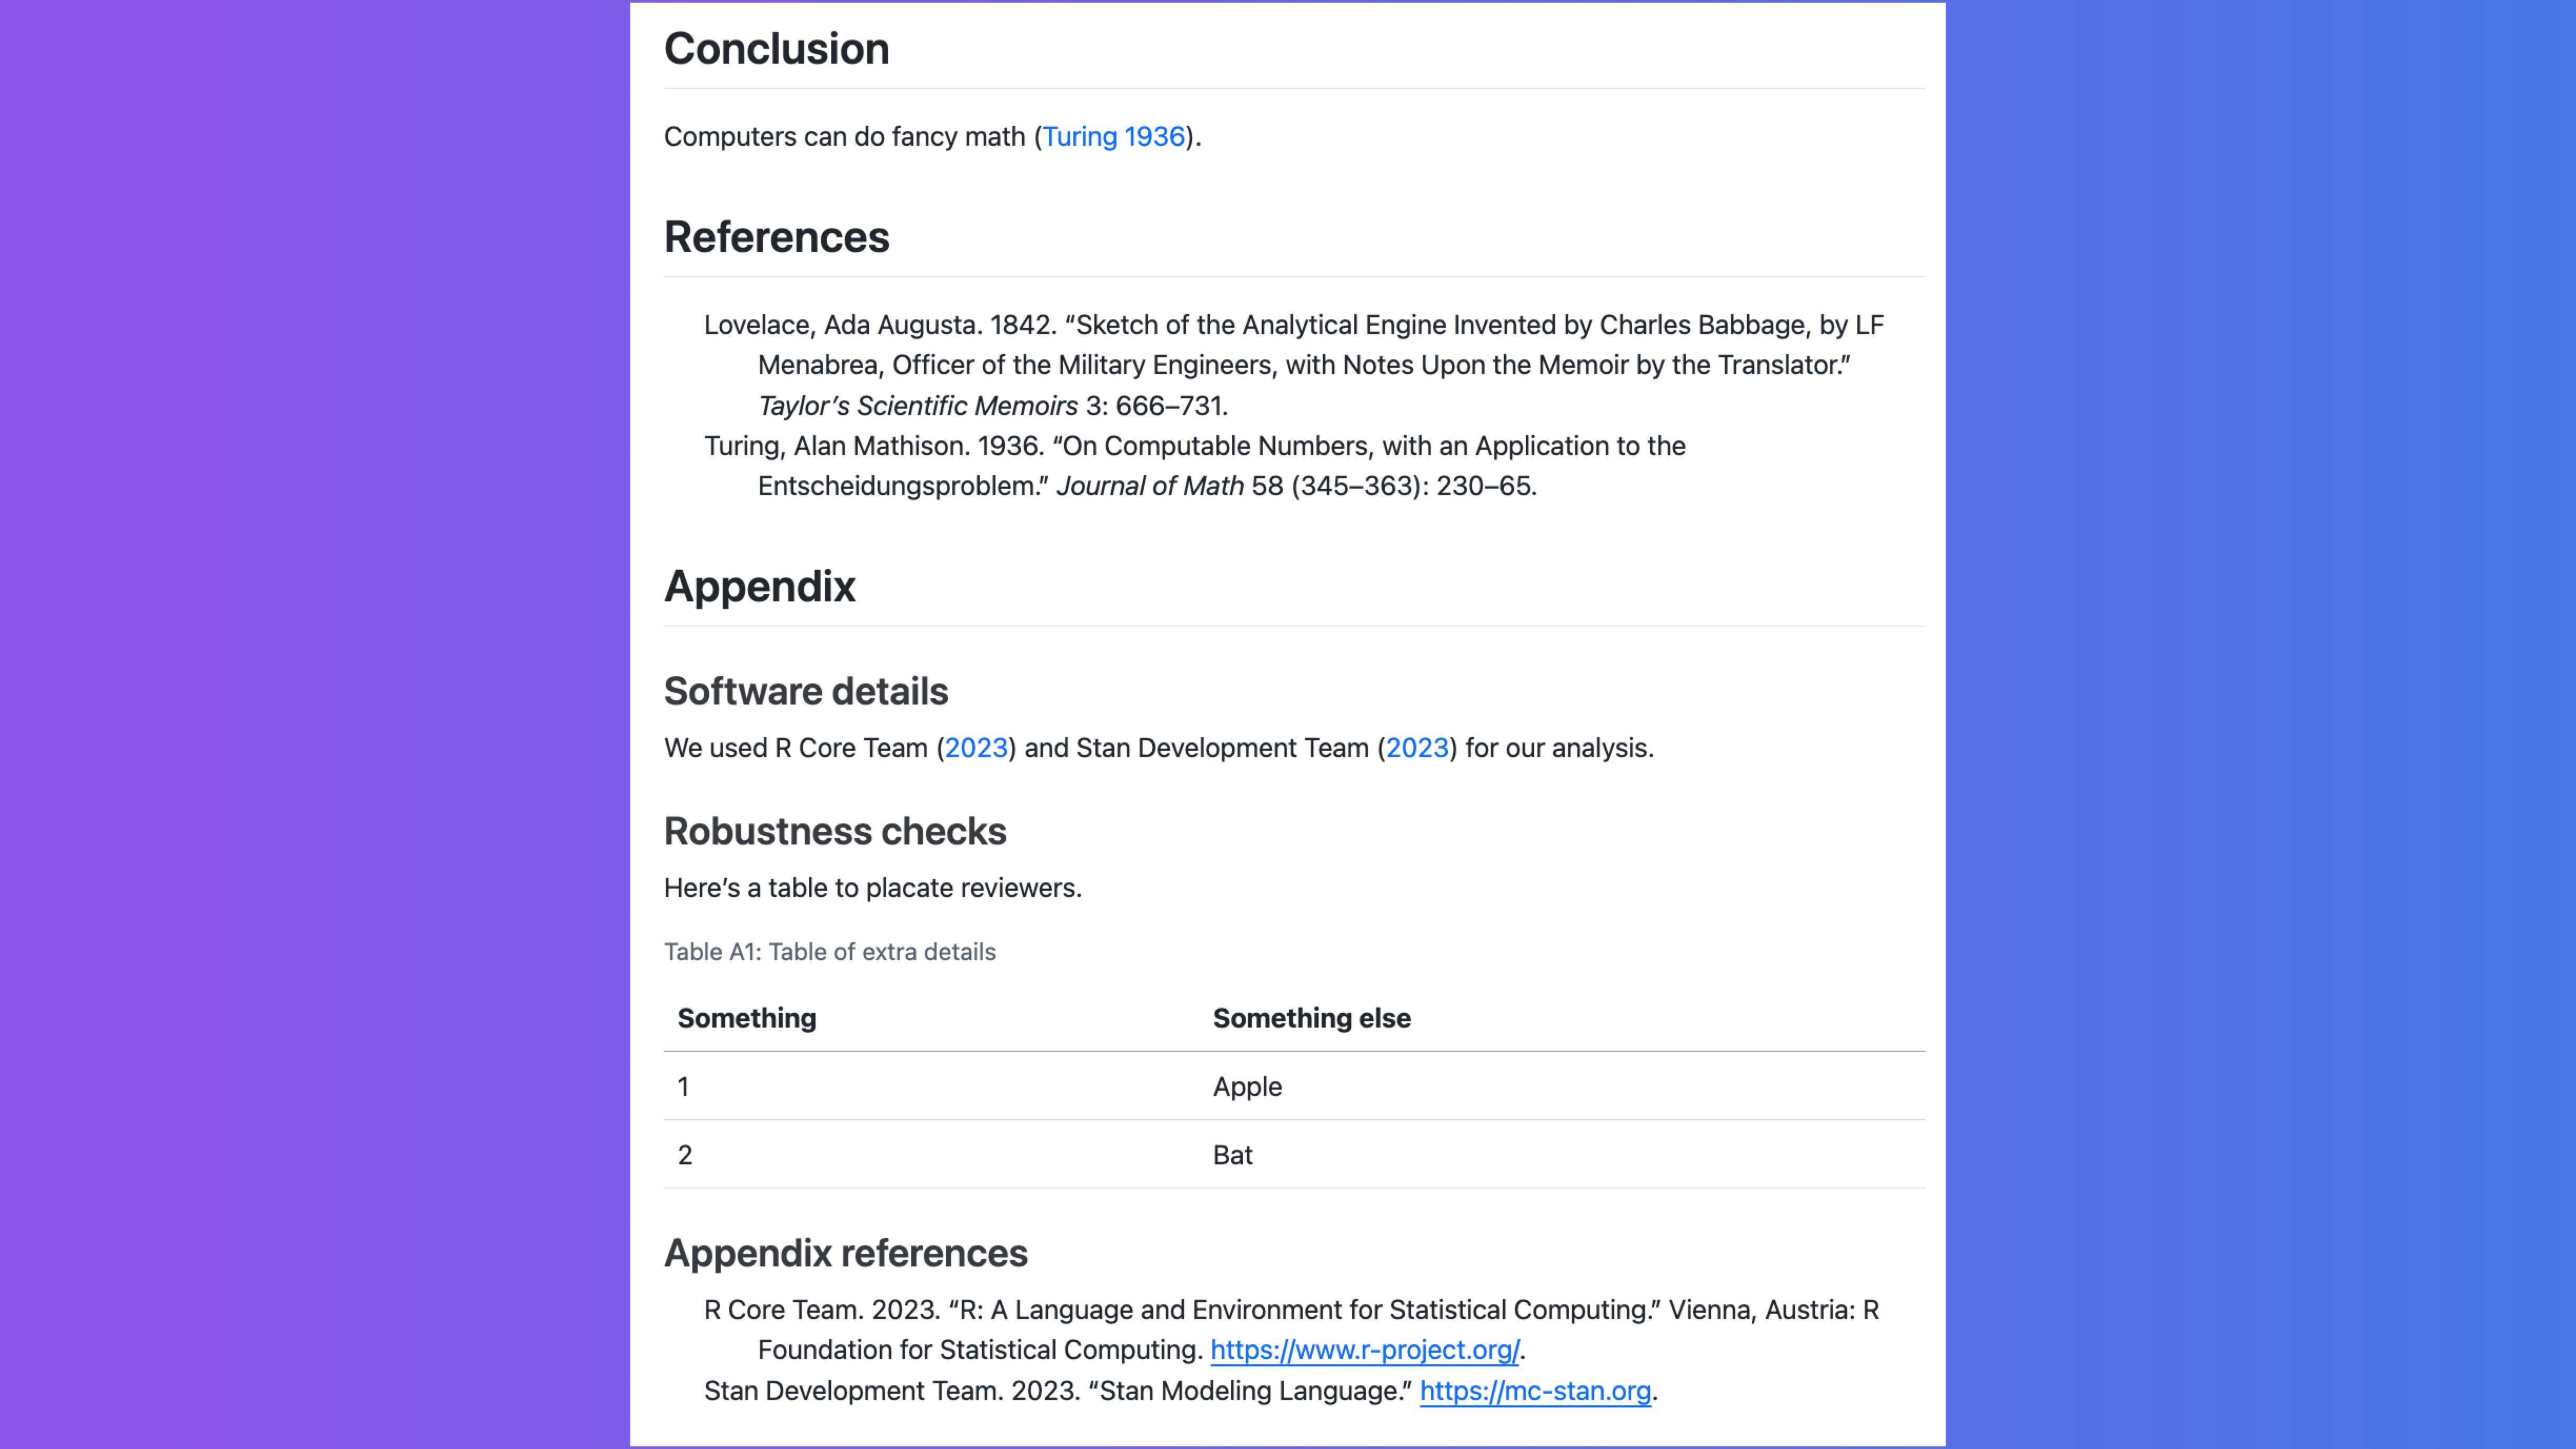
Use multibib and Quarto to create separate bibliographies for a document and an appendix
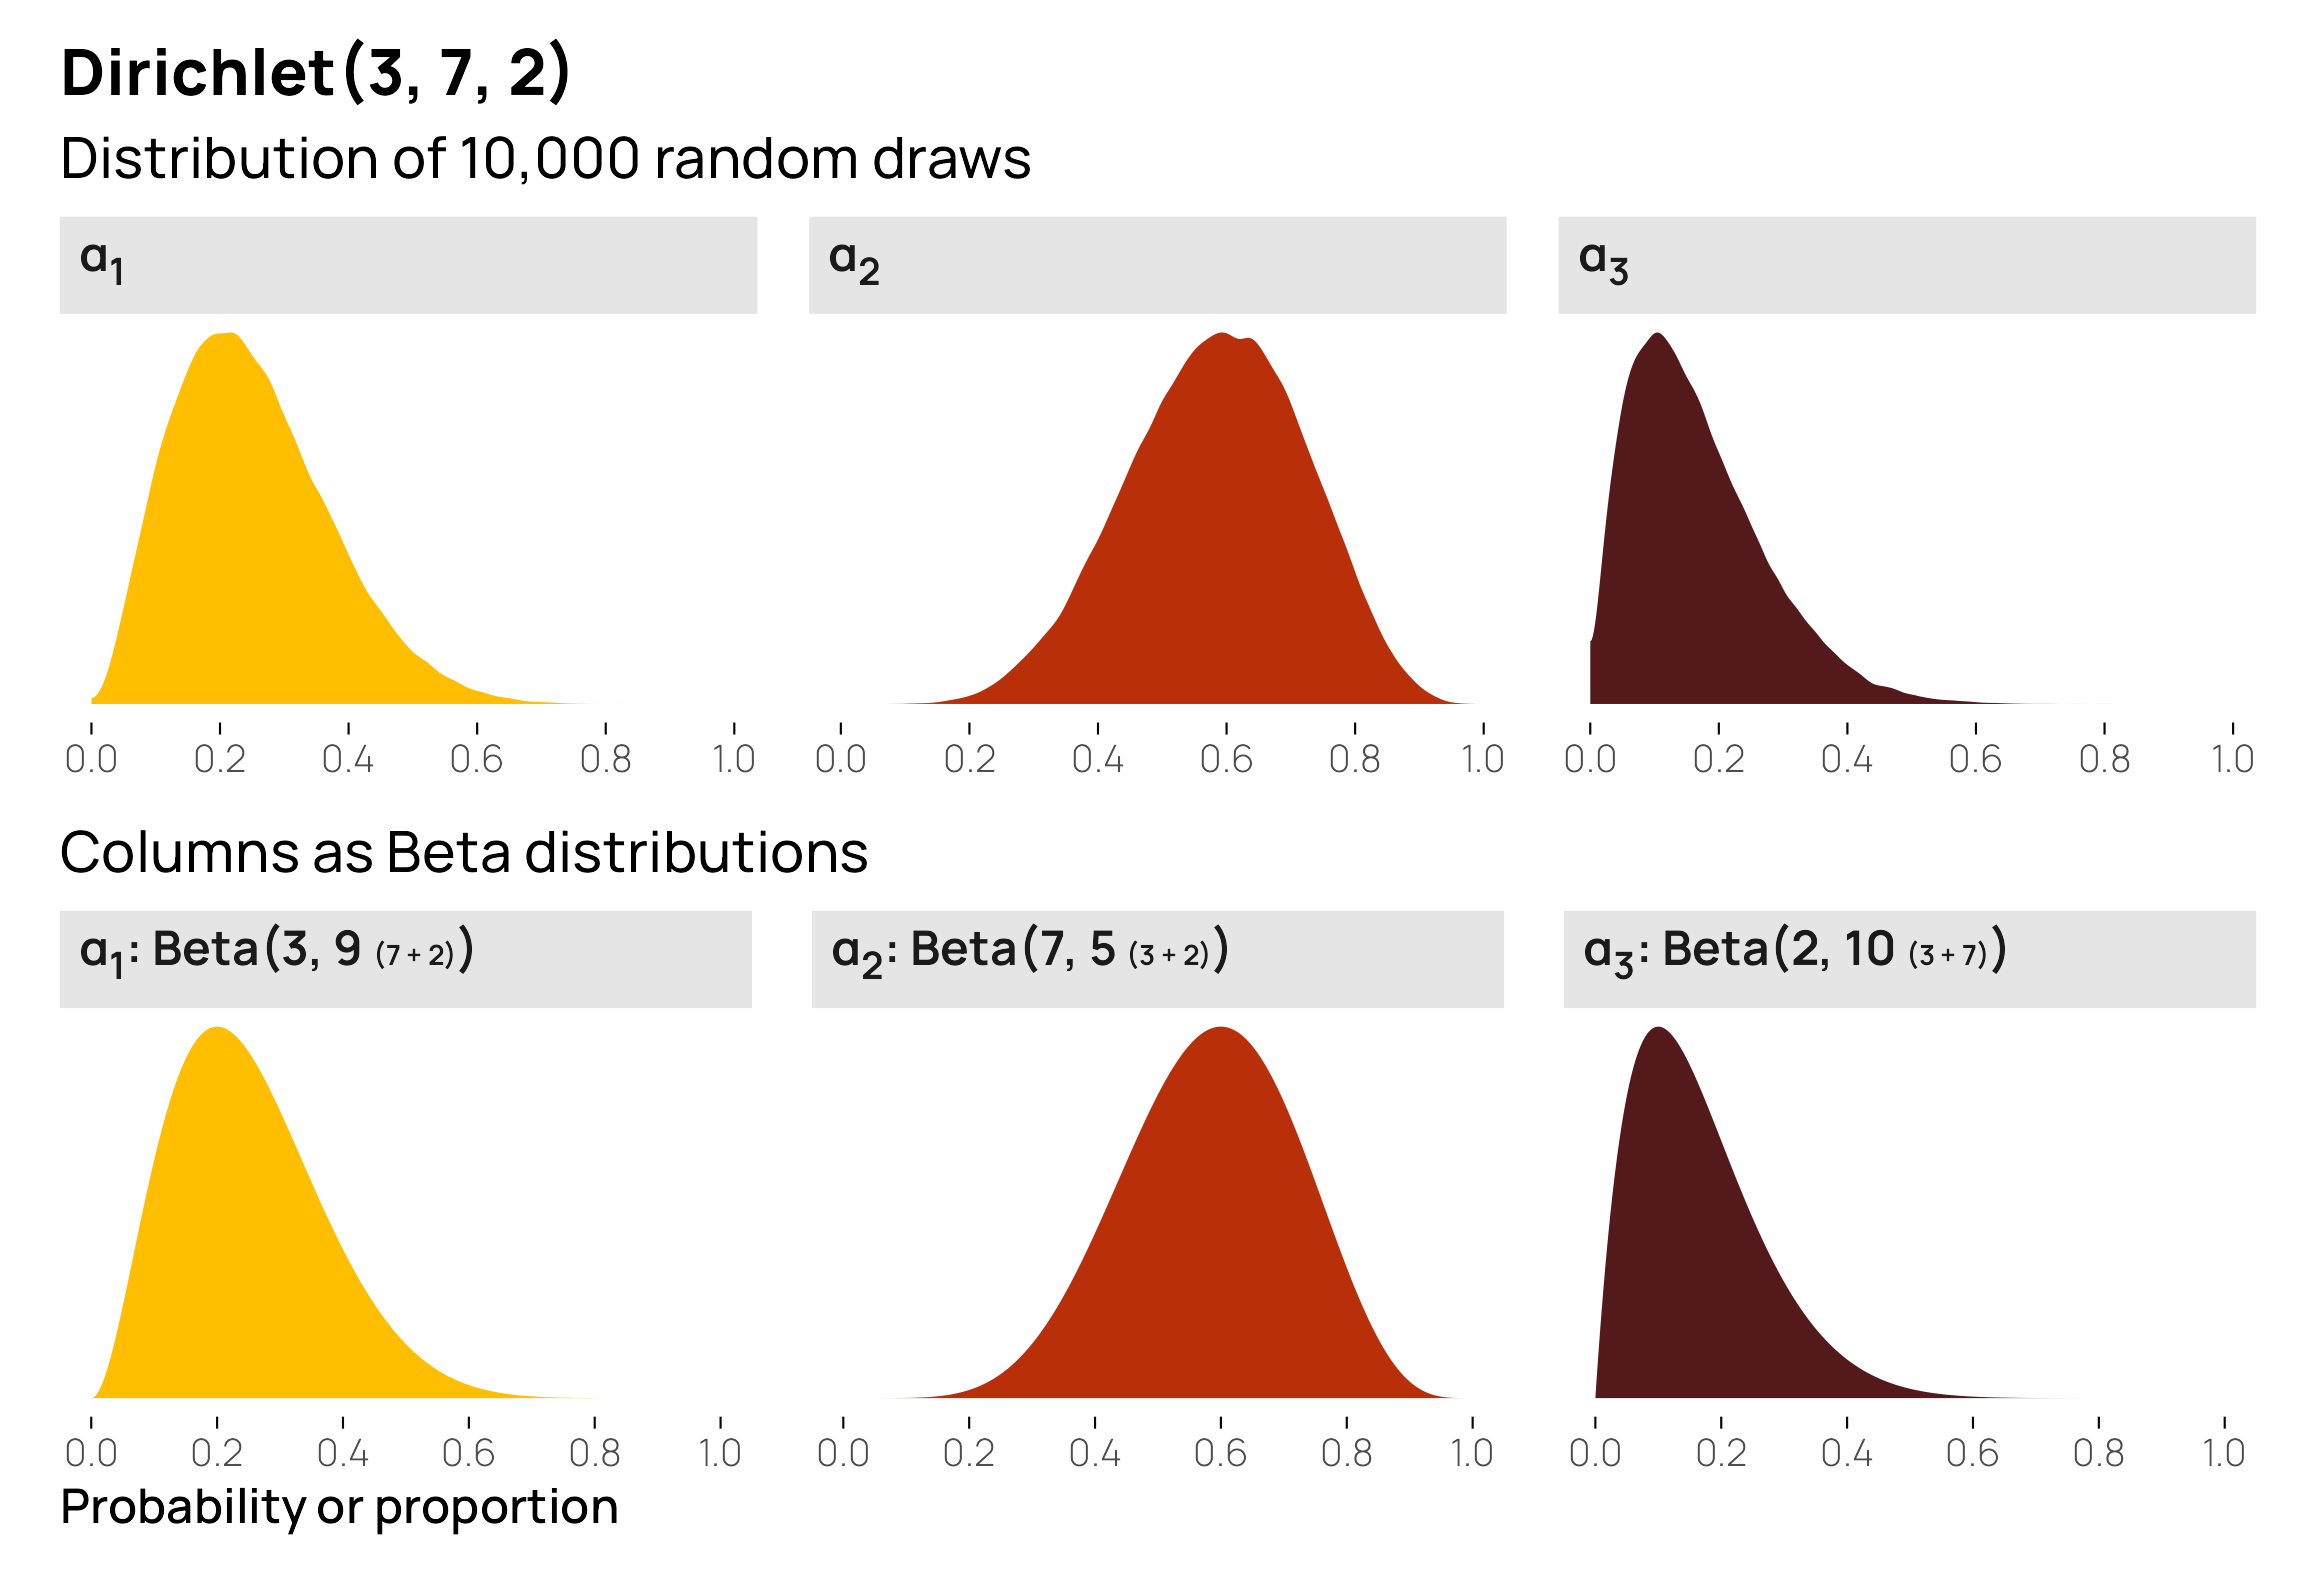
Learn about the Dirichlet distribution and explore how it’s just a fancier version of the Beta distribution
This is like basic stats stuff, but I can never remember how to do it—here’s how to use matrix multiplication to replicate the results of predict()
predict()
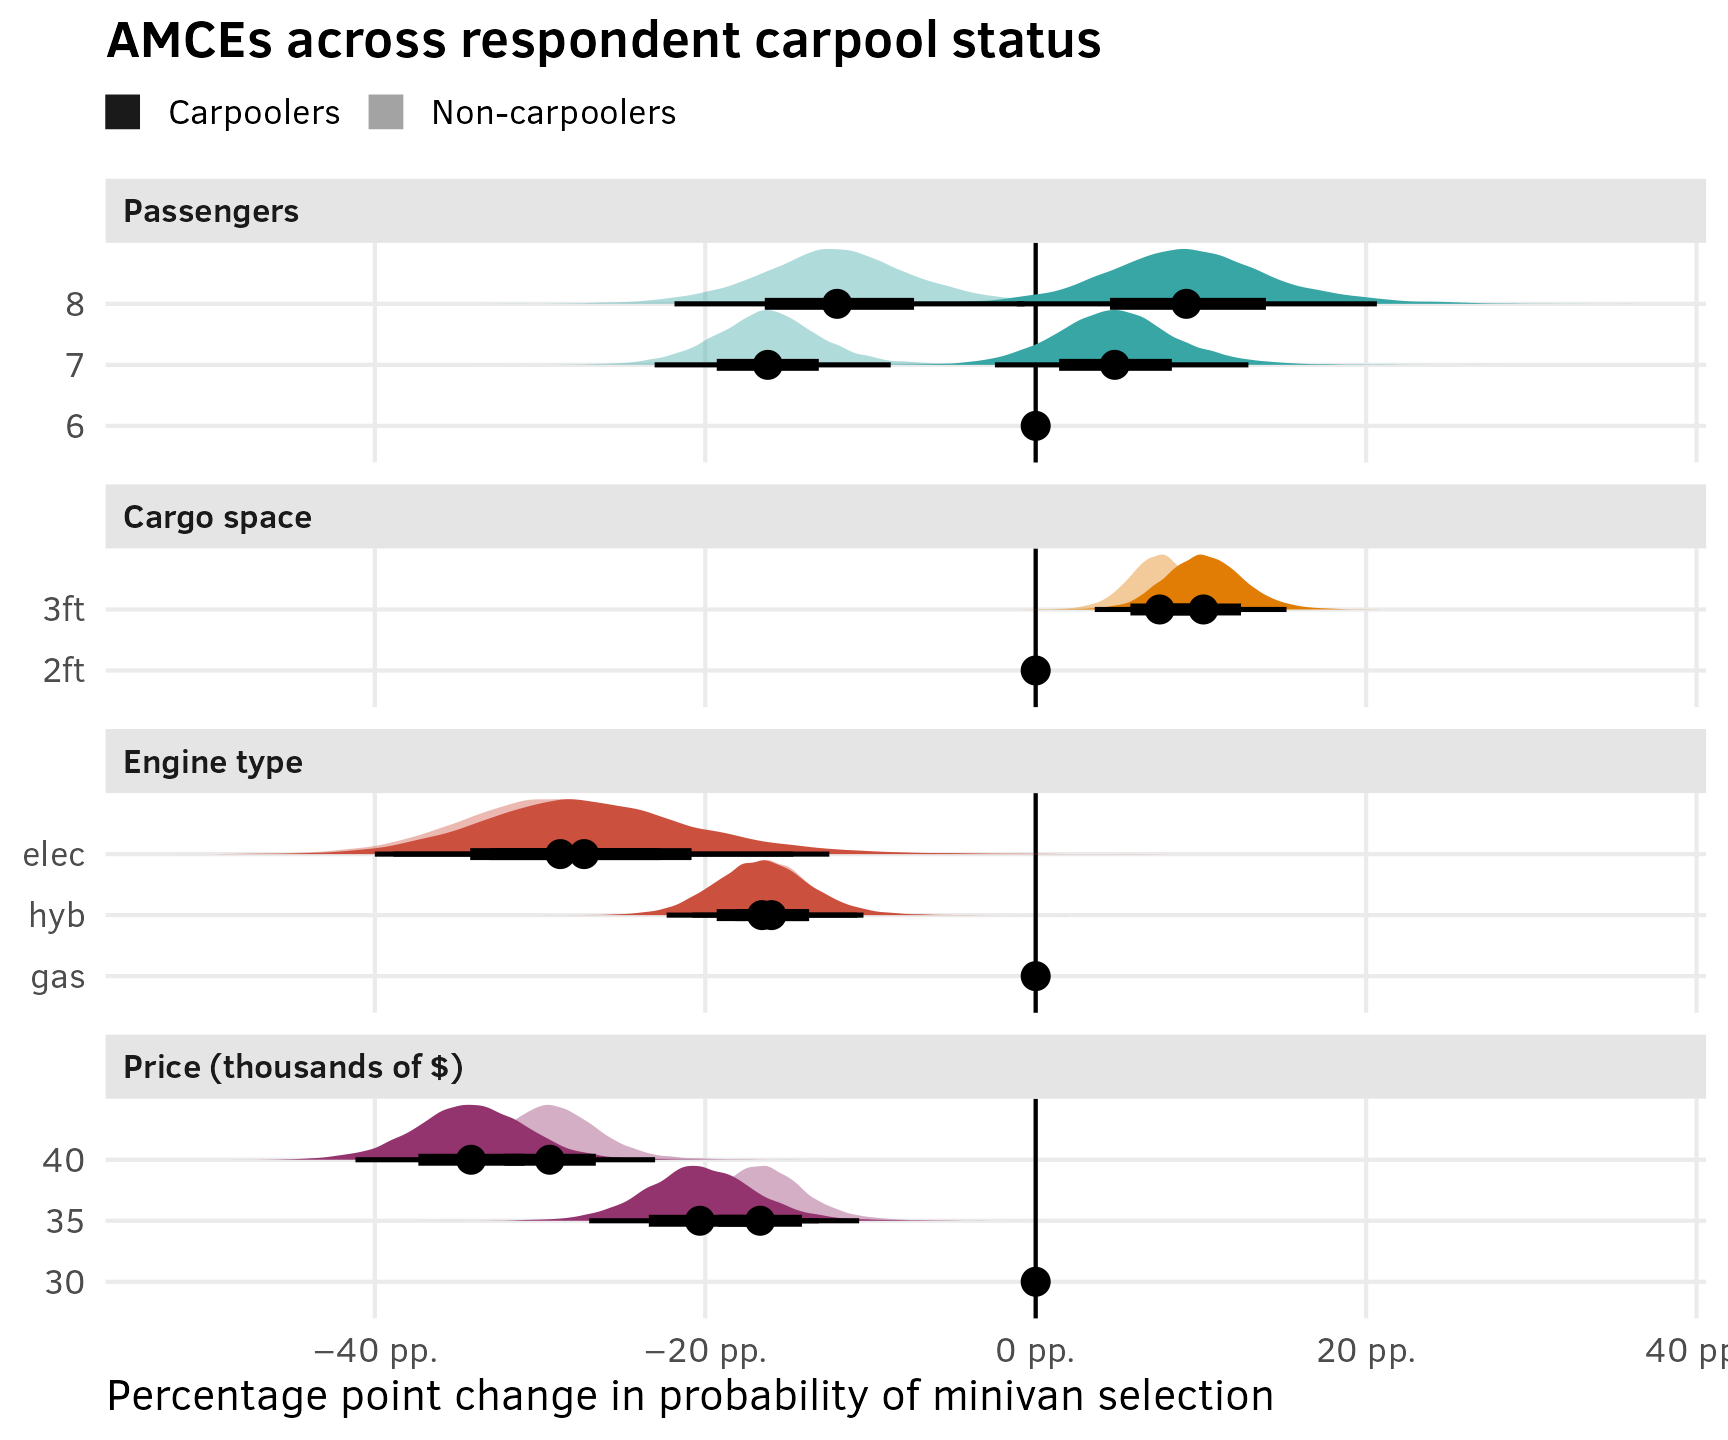
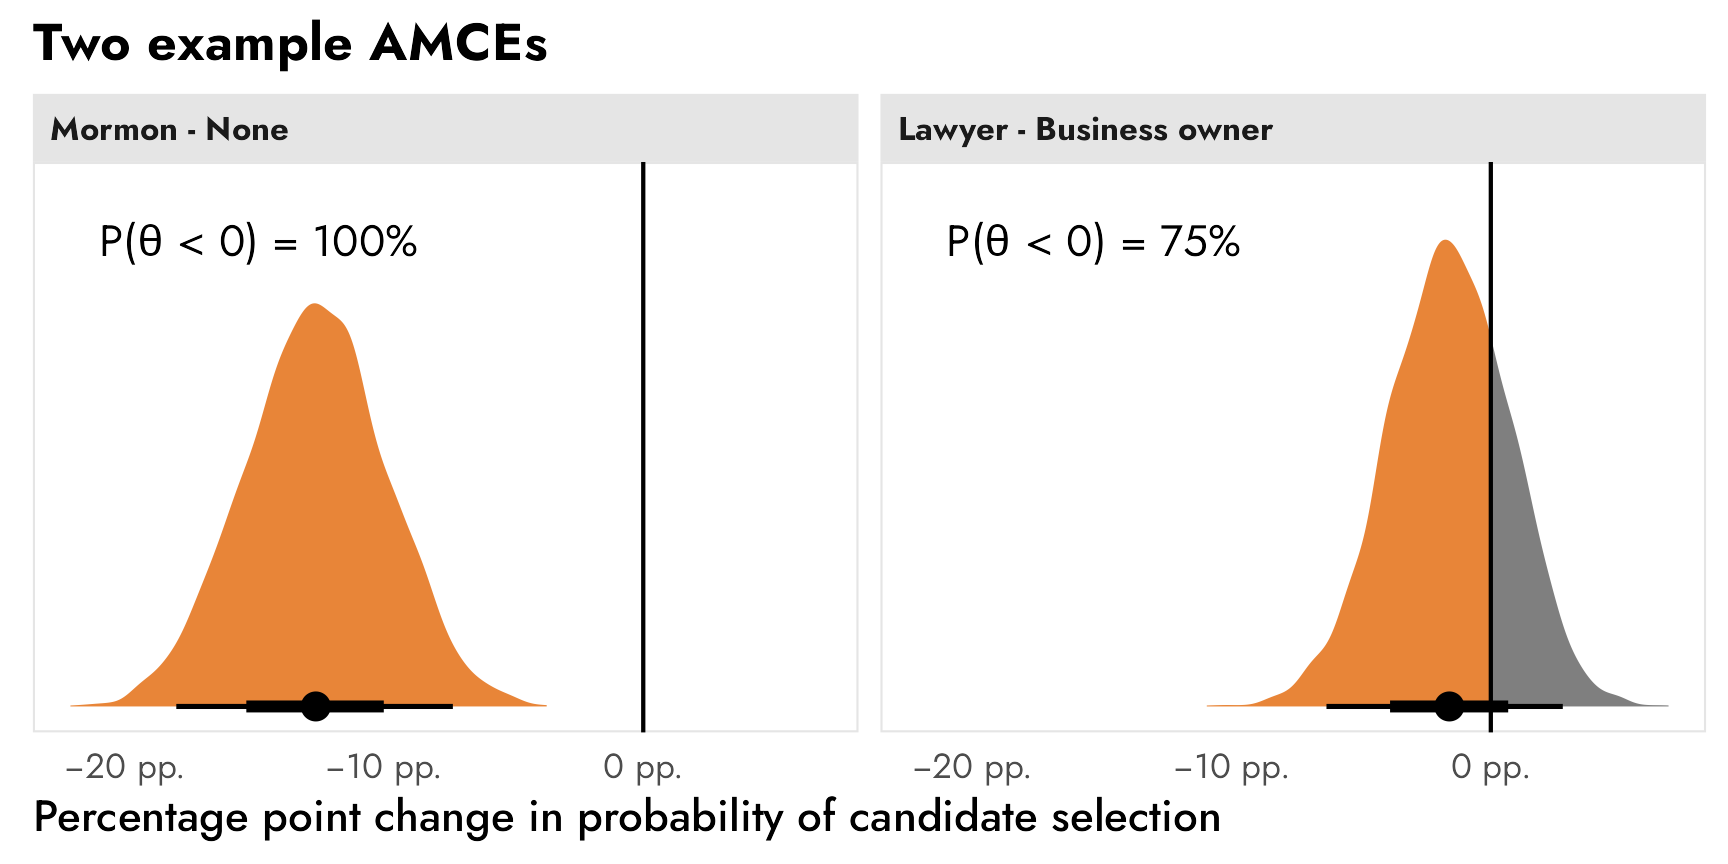
Learn how to use R, {brms}, {marginaleffects}, and {tidybayes} to analyze discrete choice conjoint data with fully specified hierarchical multilevel multinomial models
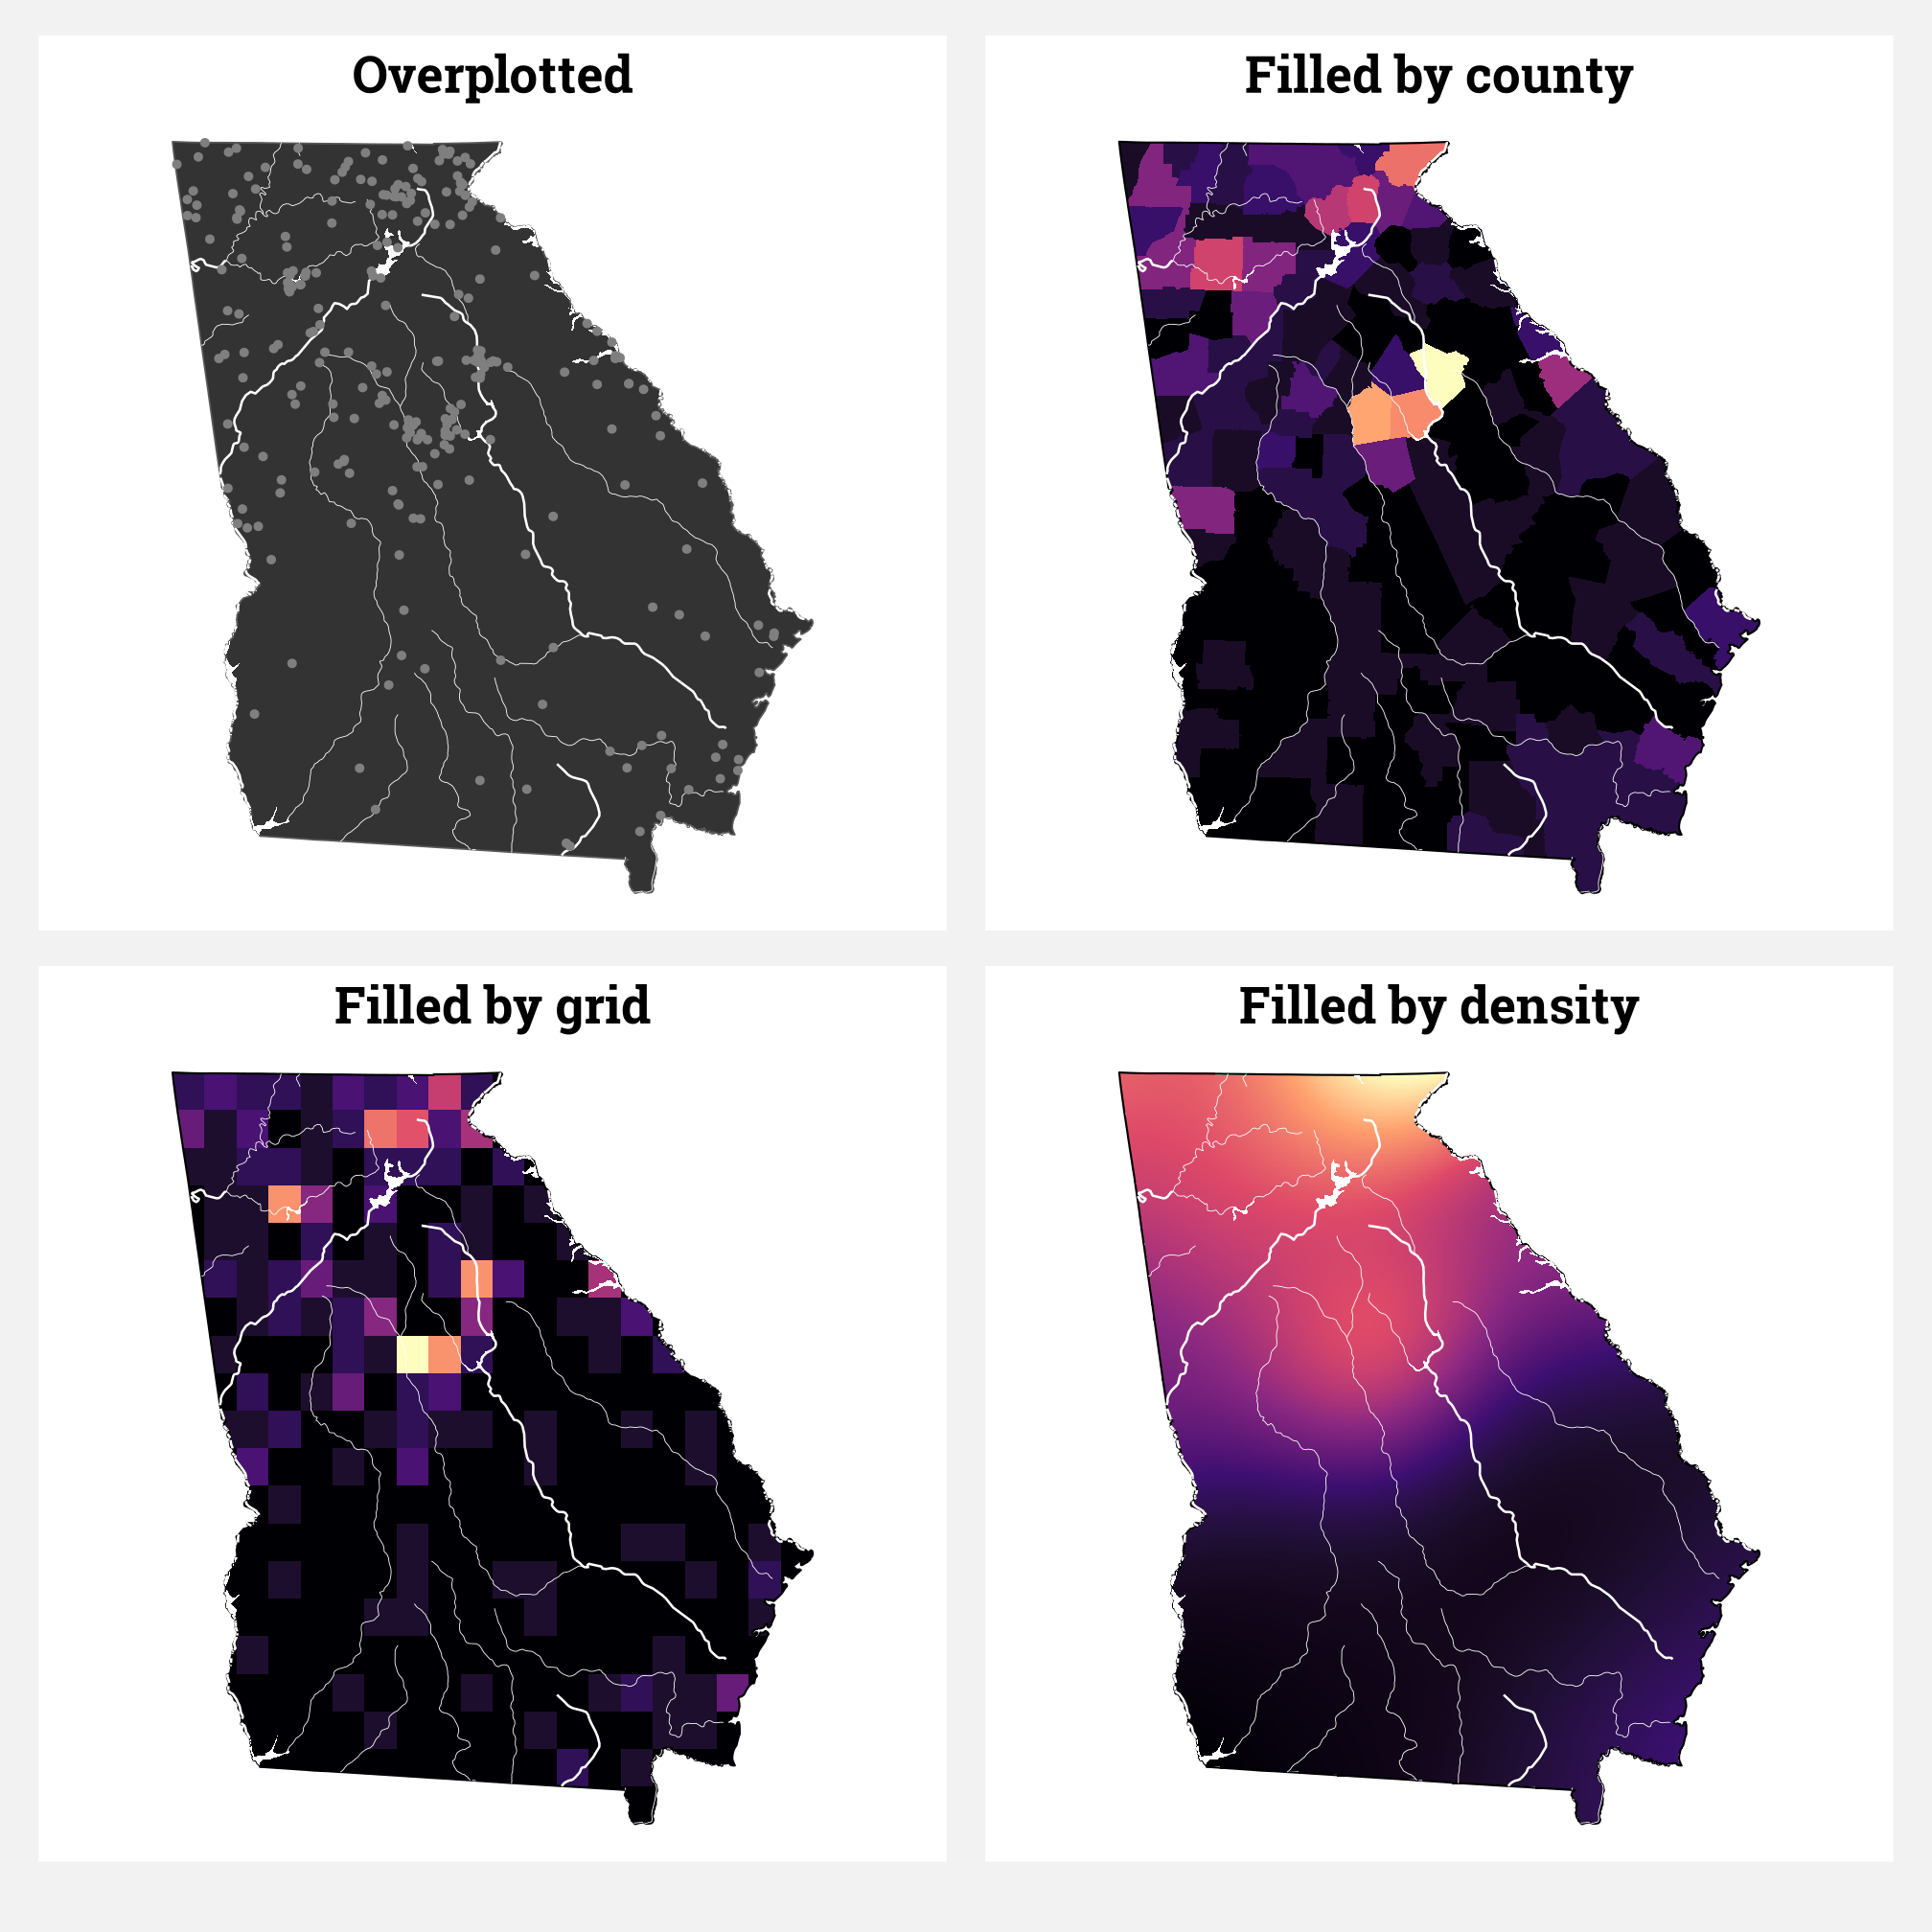
Fix overplotted points on maps by creating bins or filled density gradients using R, {ggplot2}, and {sf}
Learn how to use R, {brms}, and {marginaleffects} to analyze conjoint data and find causal and descriptive quantities of interest, both frequentistly and Bayesianly
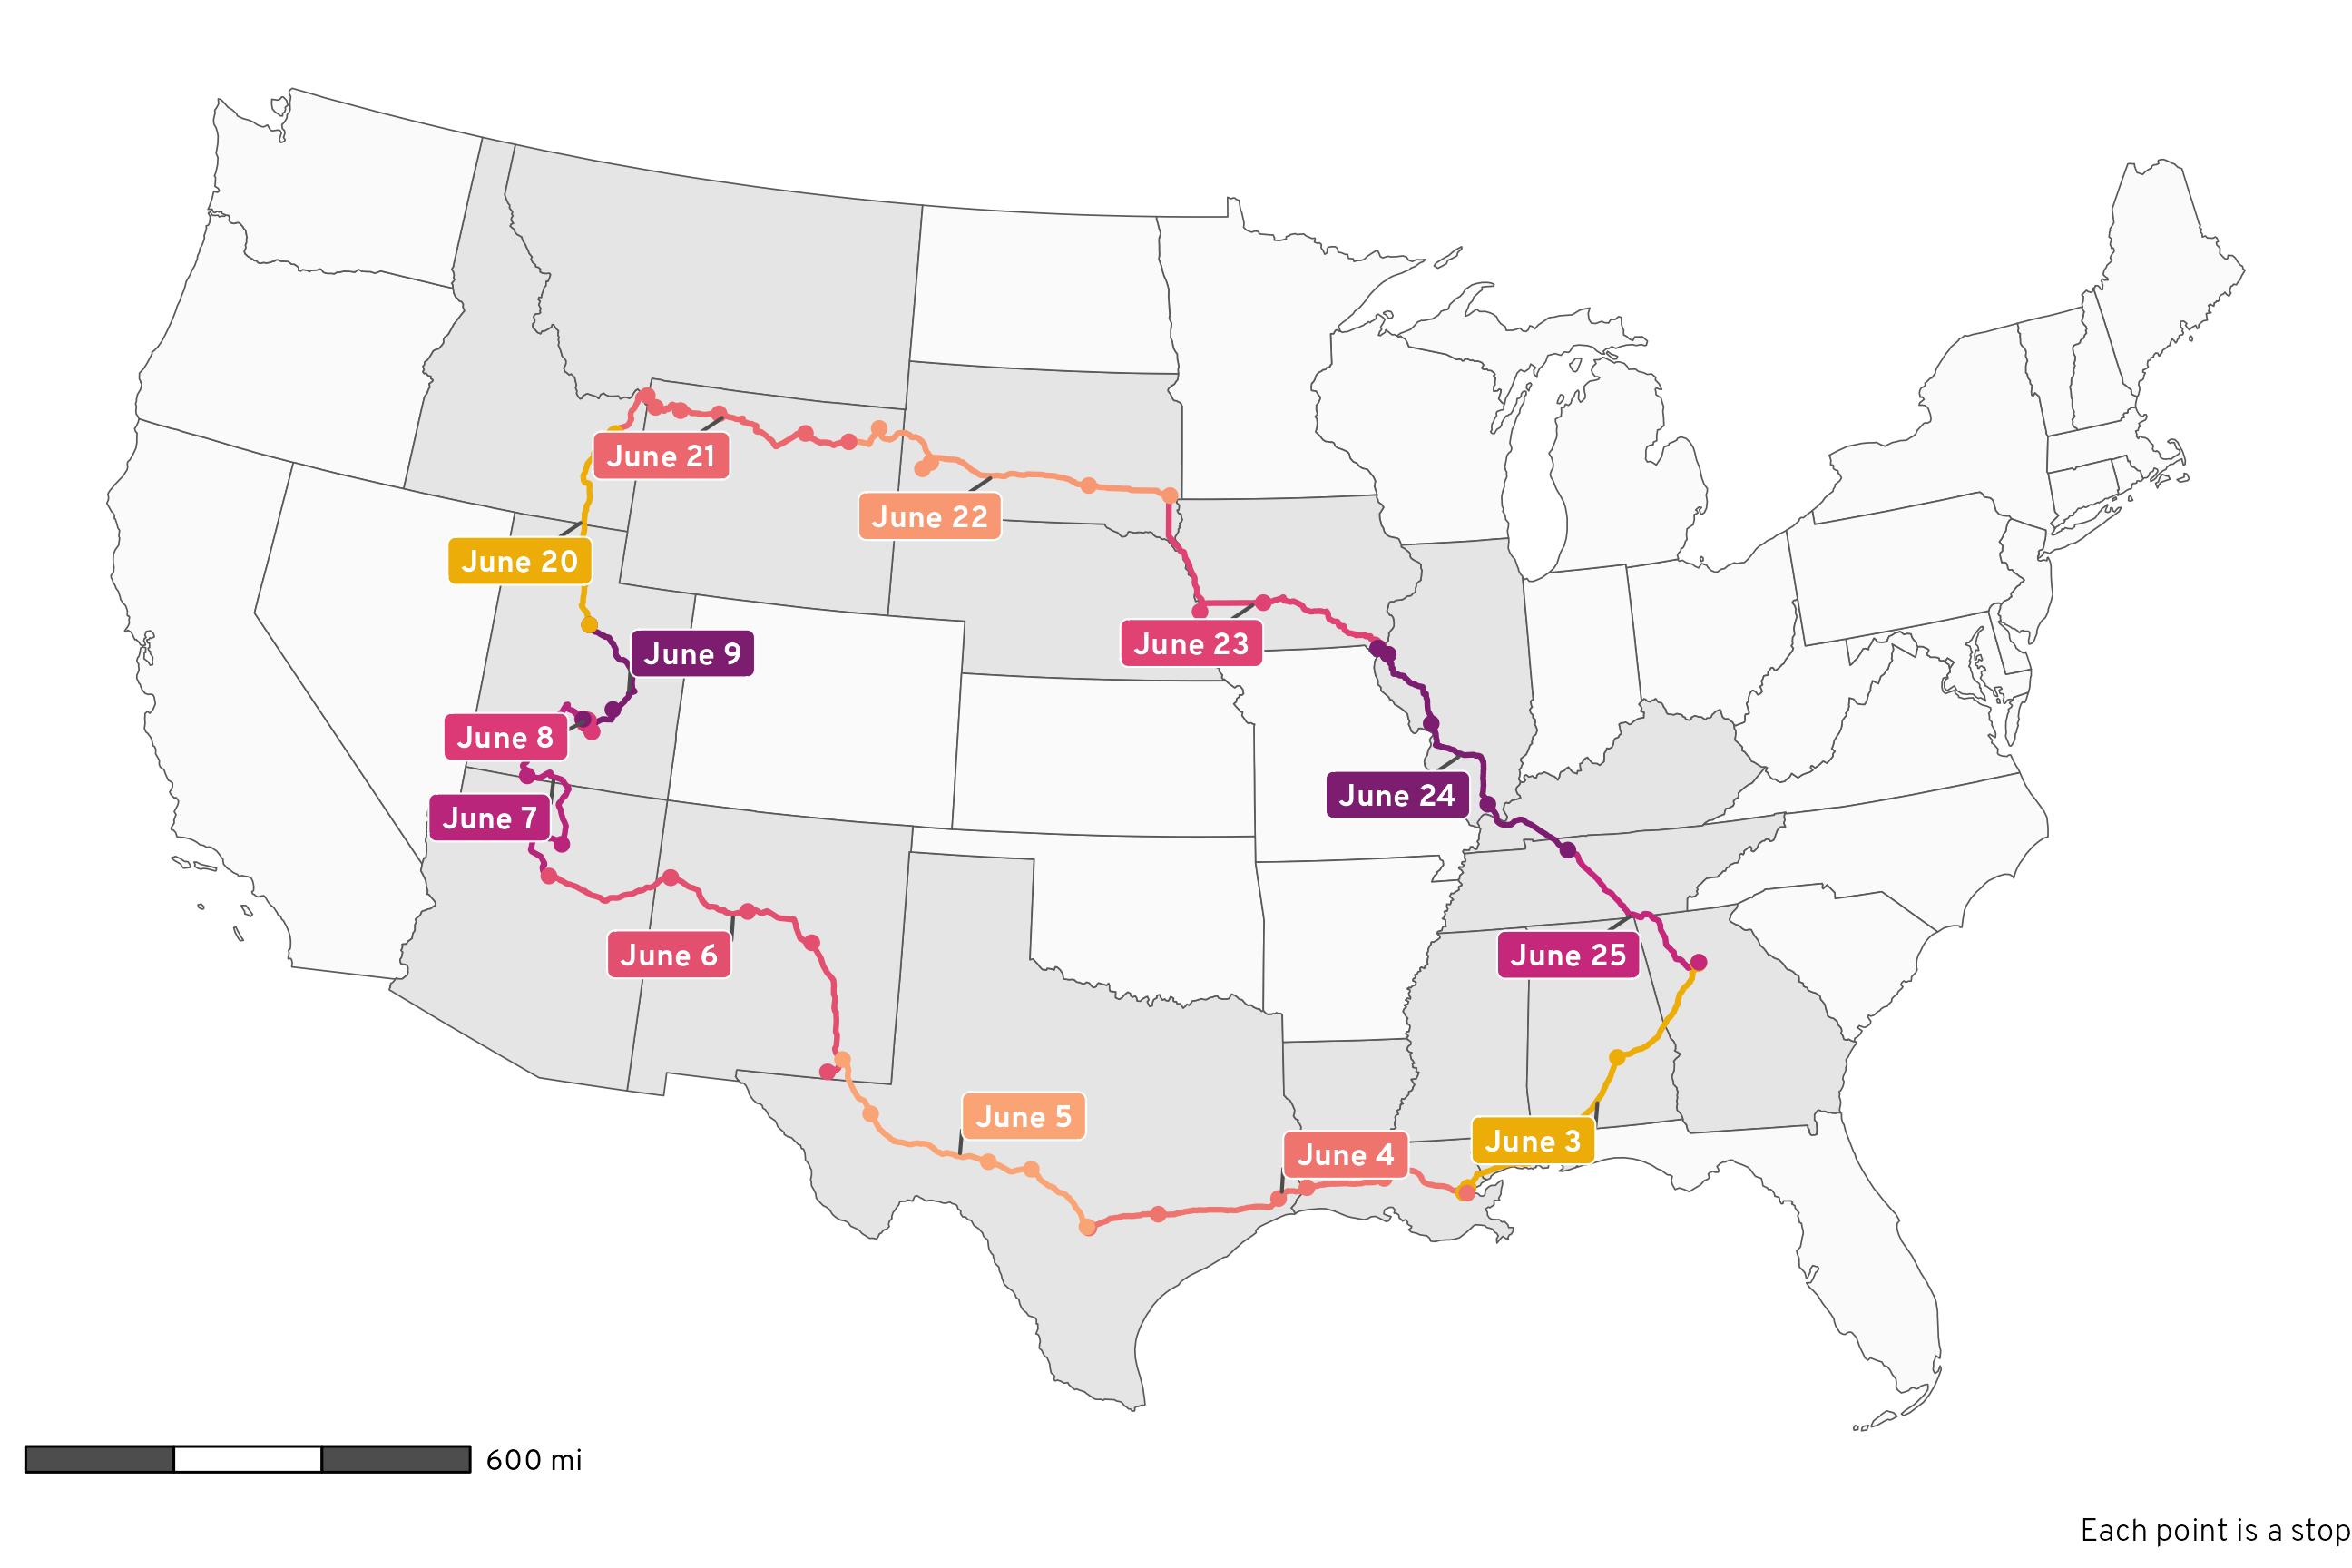
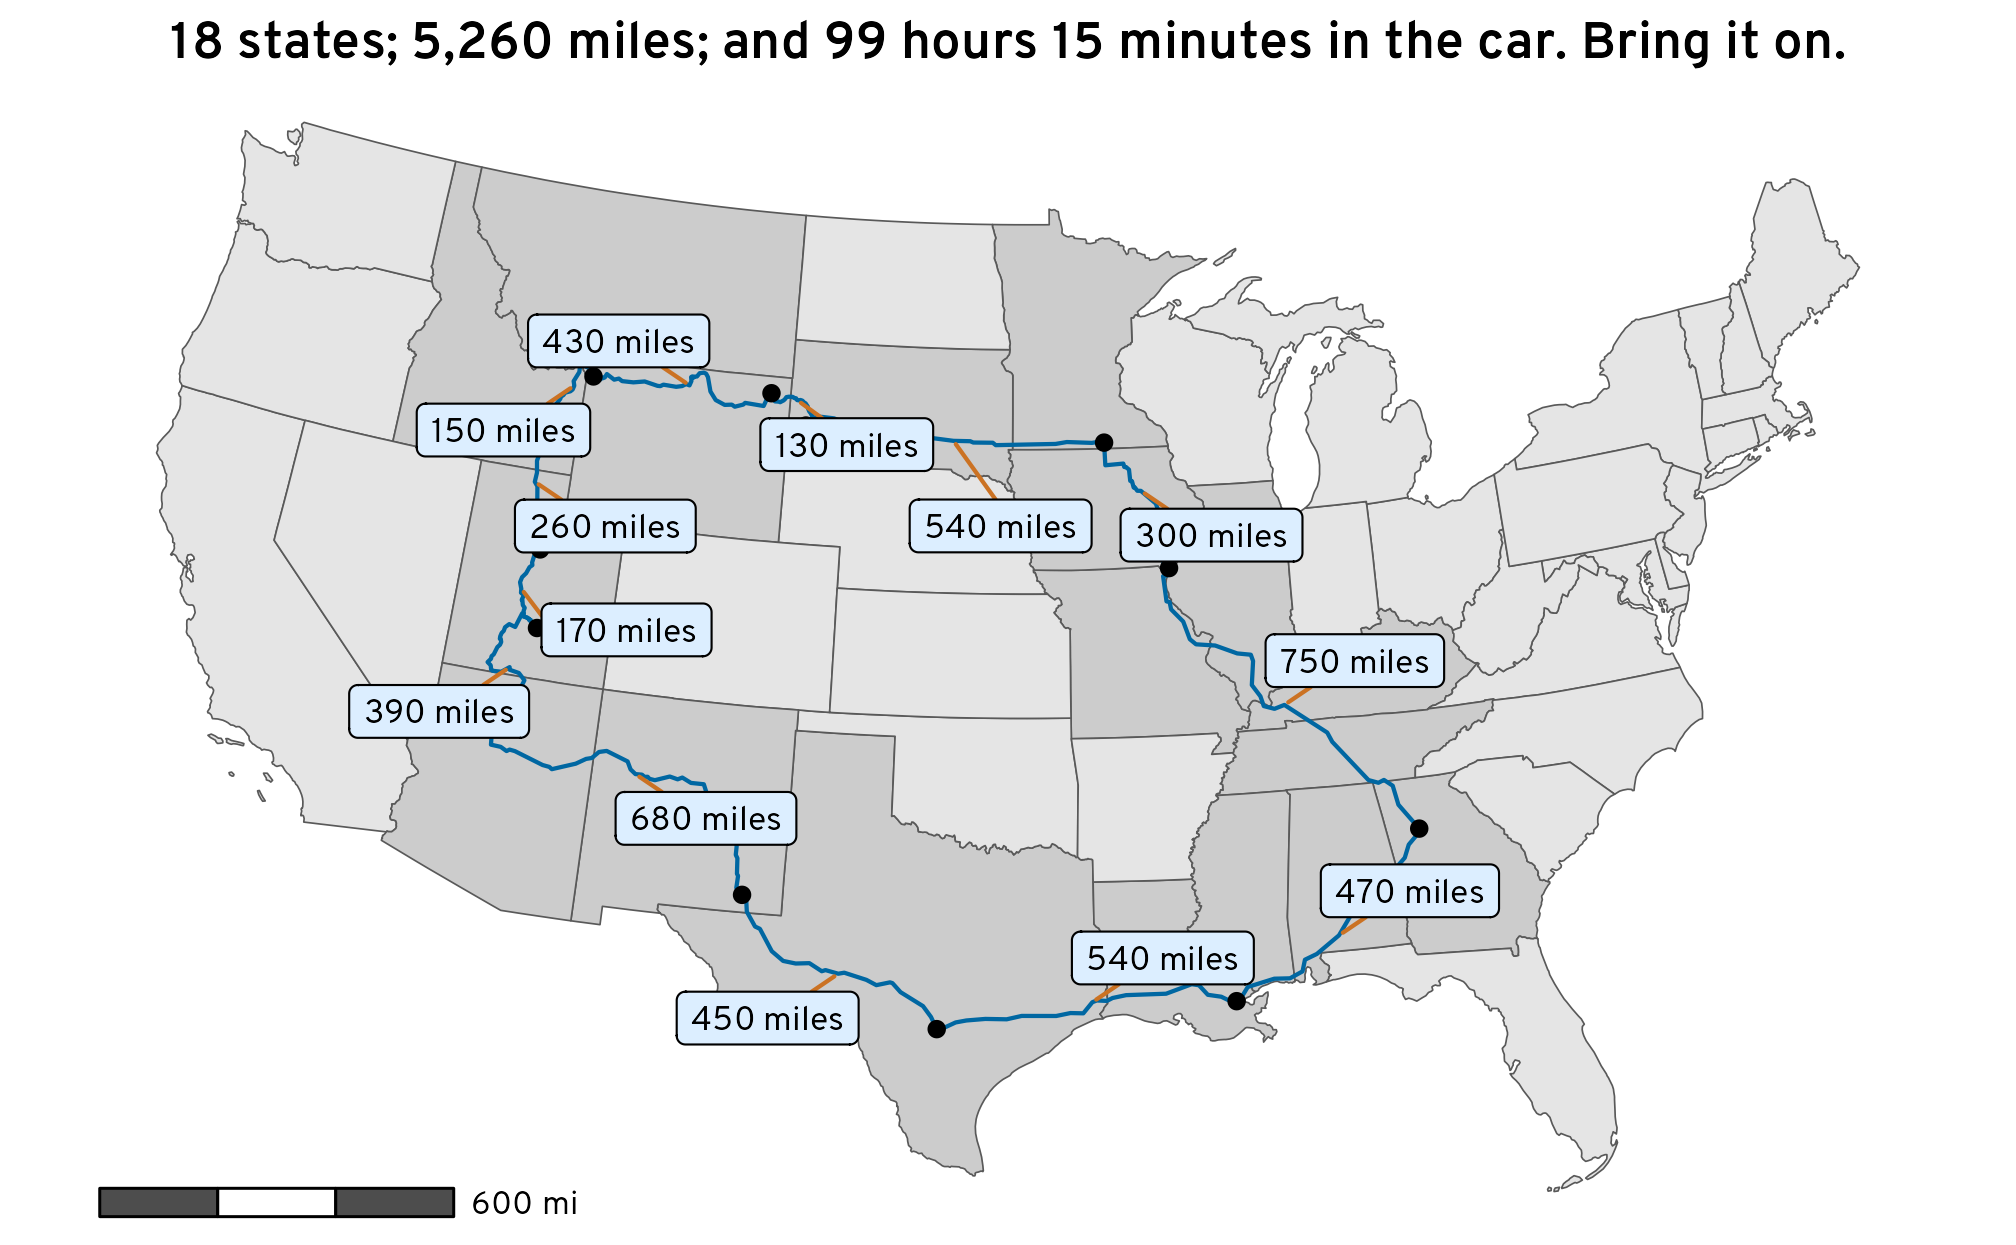
Learn how to use R to load and clean and play with all the location history data Google keeps about you and look at some neat plots and tables about our 5,000-mile summer road trip along the way
Use R to get geocoded location and routing data from OpenStreetMap and explore our family’s impending 5,000 mile road trip around the USA
Use R, Stan, and {brms} to calculate differences between categorical proportions in a principled Bayesian way
Explore Tolkien’s Middle Earth with R-based GIS tools, including {ggplot2} and {sf}
Use statistical simulation and a hidden table of Númenórean ages from Tolkien’s unpublished works to convert Aragorn’s Dúnedan years to actual human years
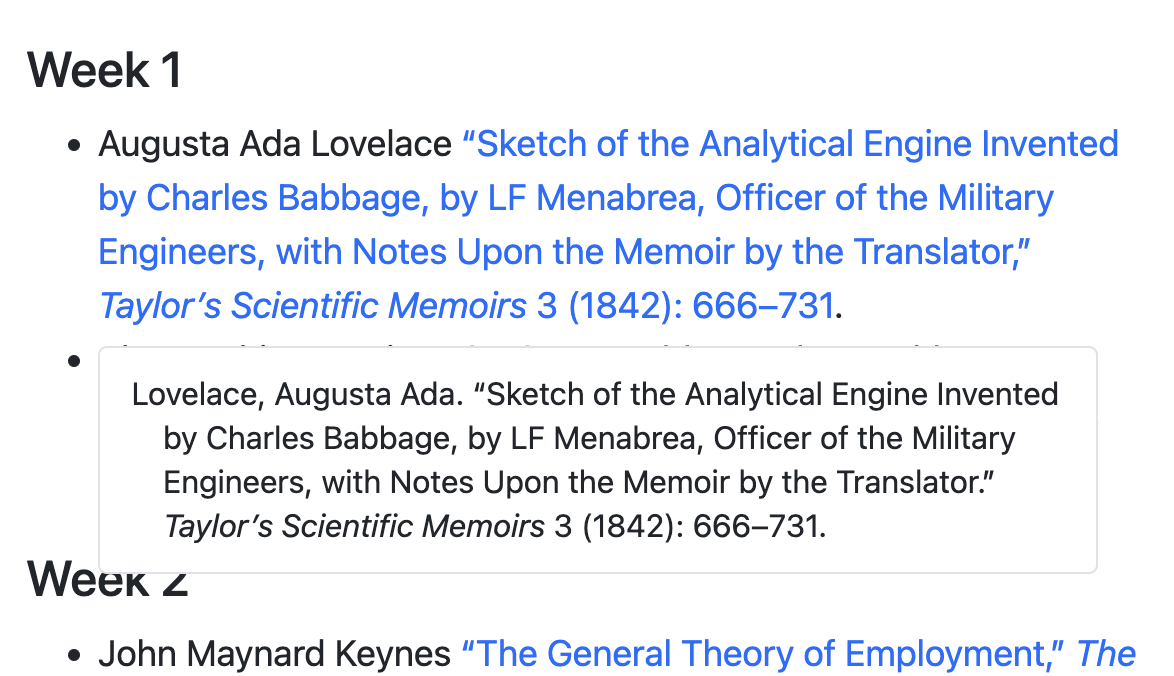
By default, pandoc doesn’t include full bibliographic references inline in documents, but with one tweak to a CSL file, you can create syllabus-like lists of citations with full references
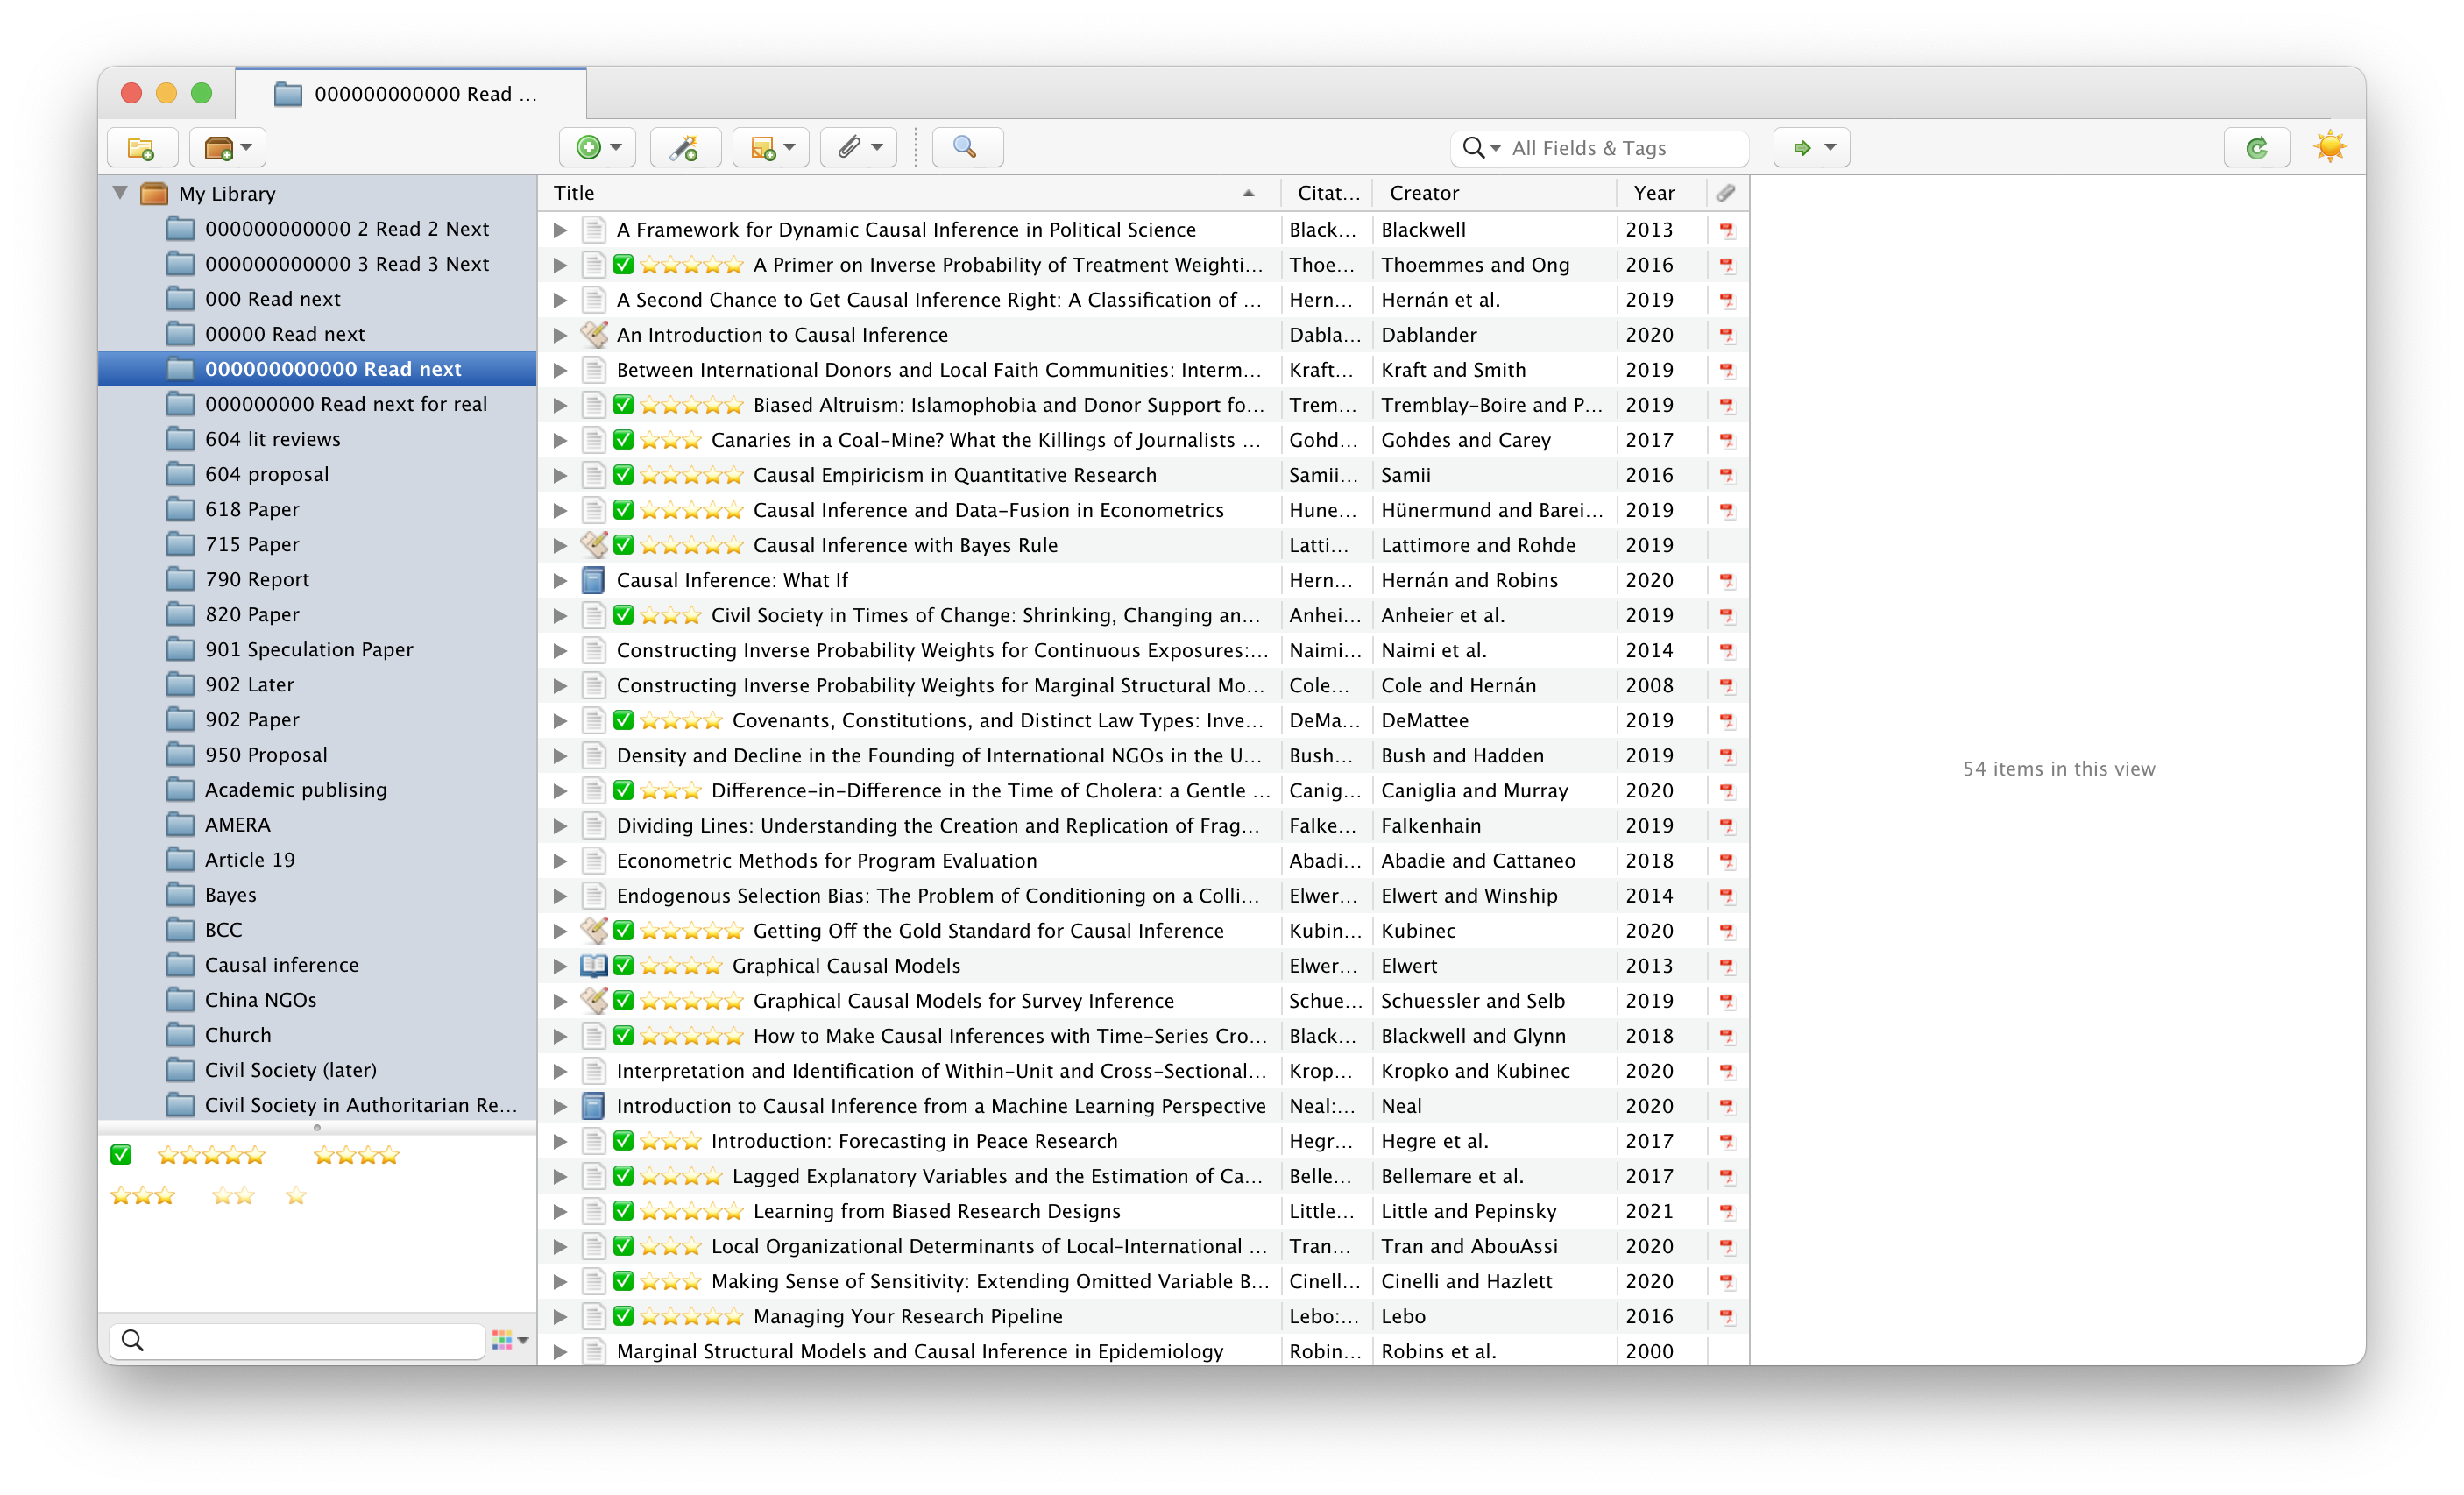
Tips, tricks, and rationale for converting from a single big BibTeX file to a Zotero database
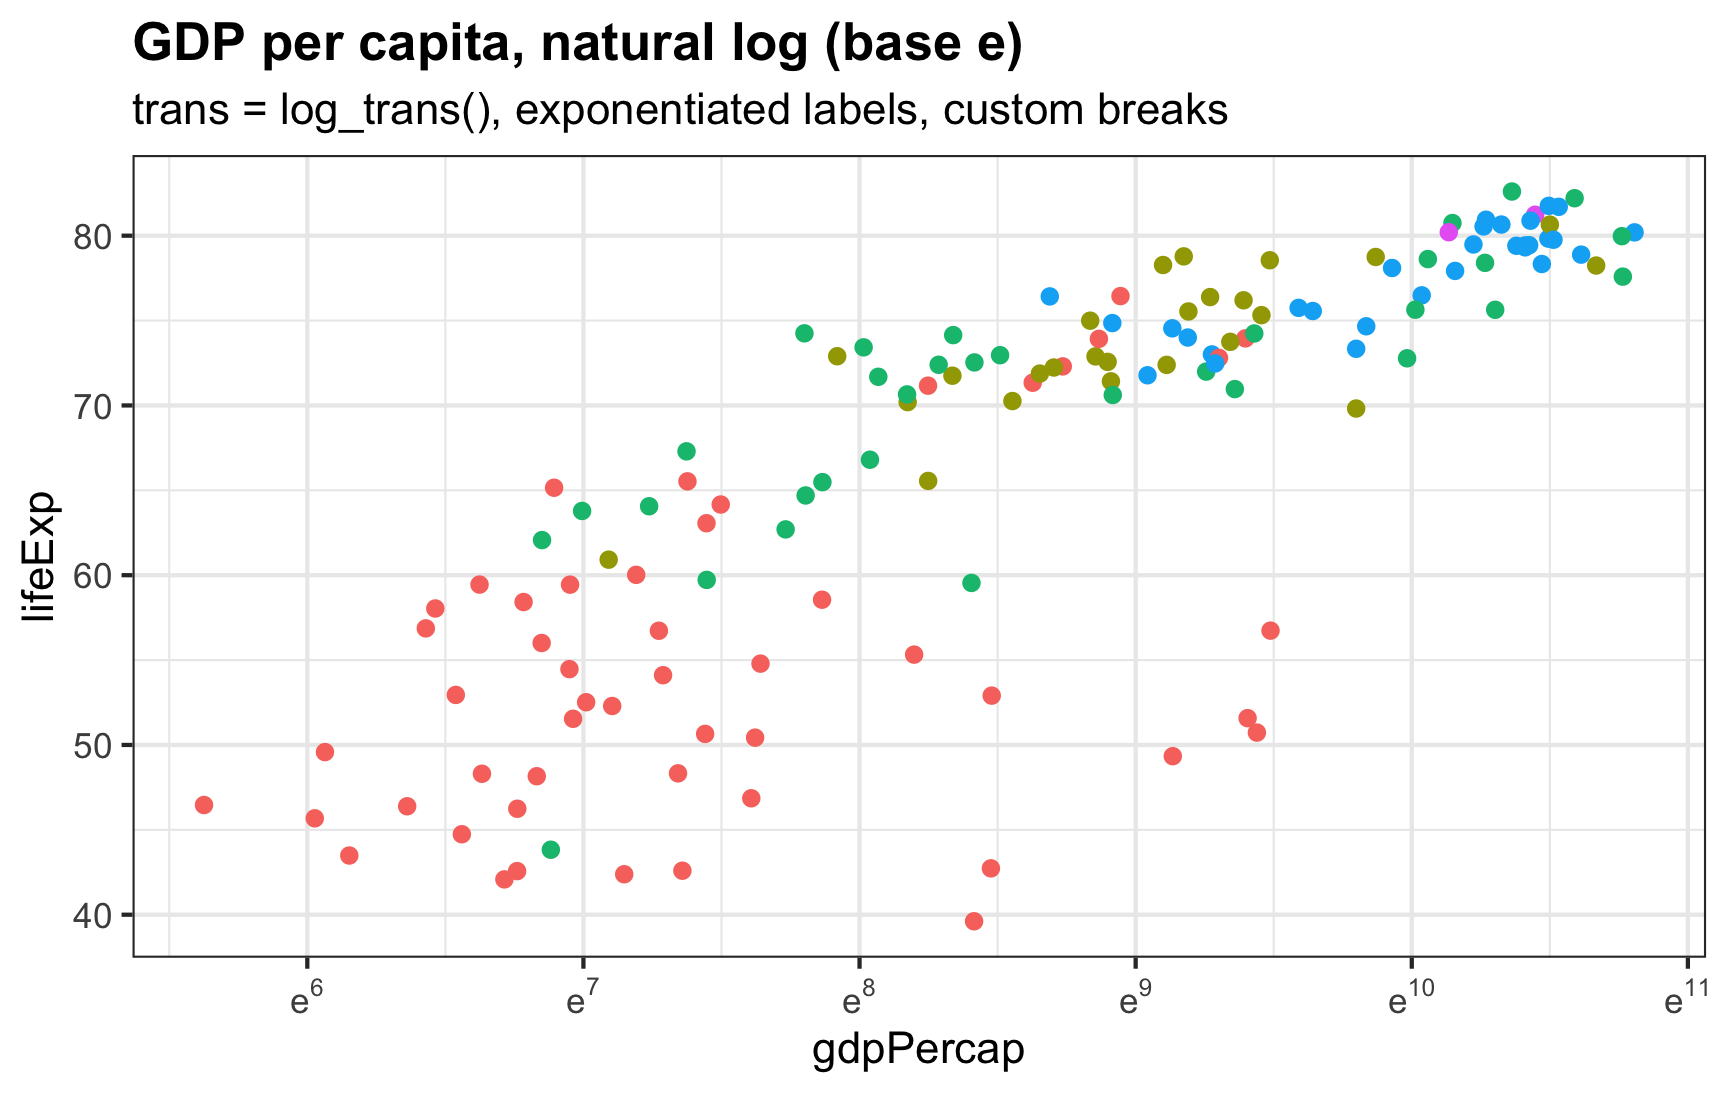
Use the {scales} R package to automatically adjust and format x- and y-axis scales to use log base 10 and natural log values
Use the {marginaleffects} package to calculate tricky and nuanced marginal and conditional effects in generalized linear mixed models
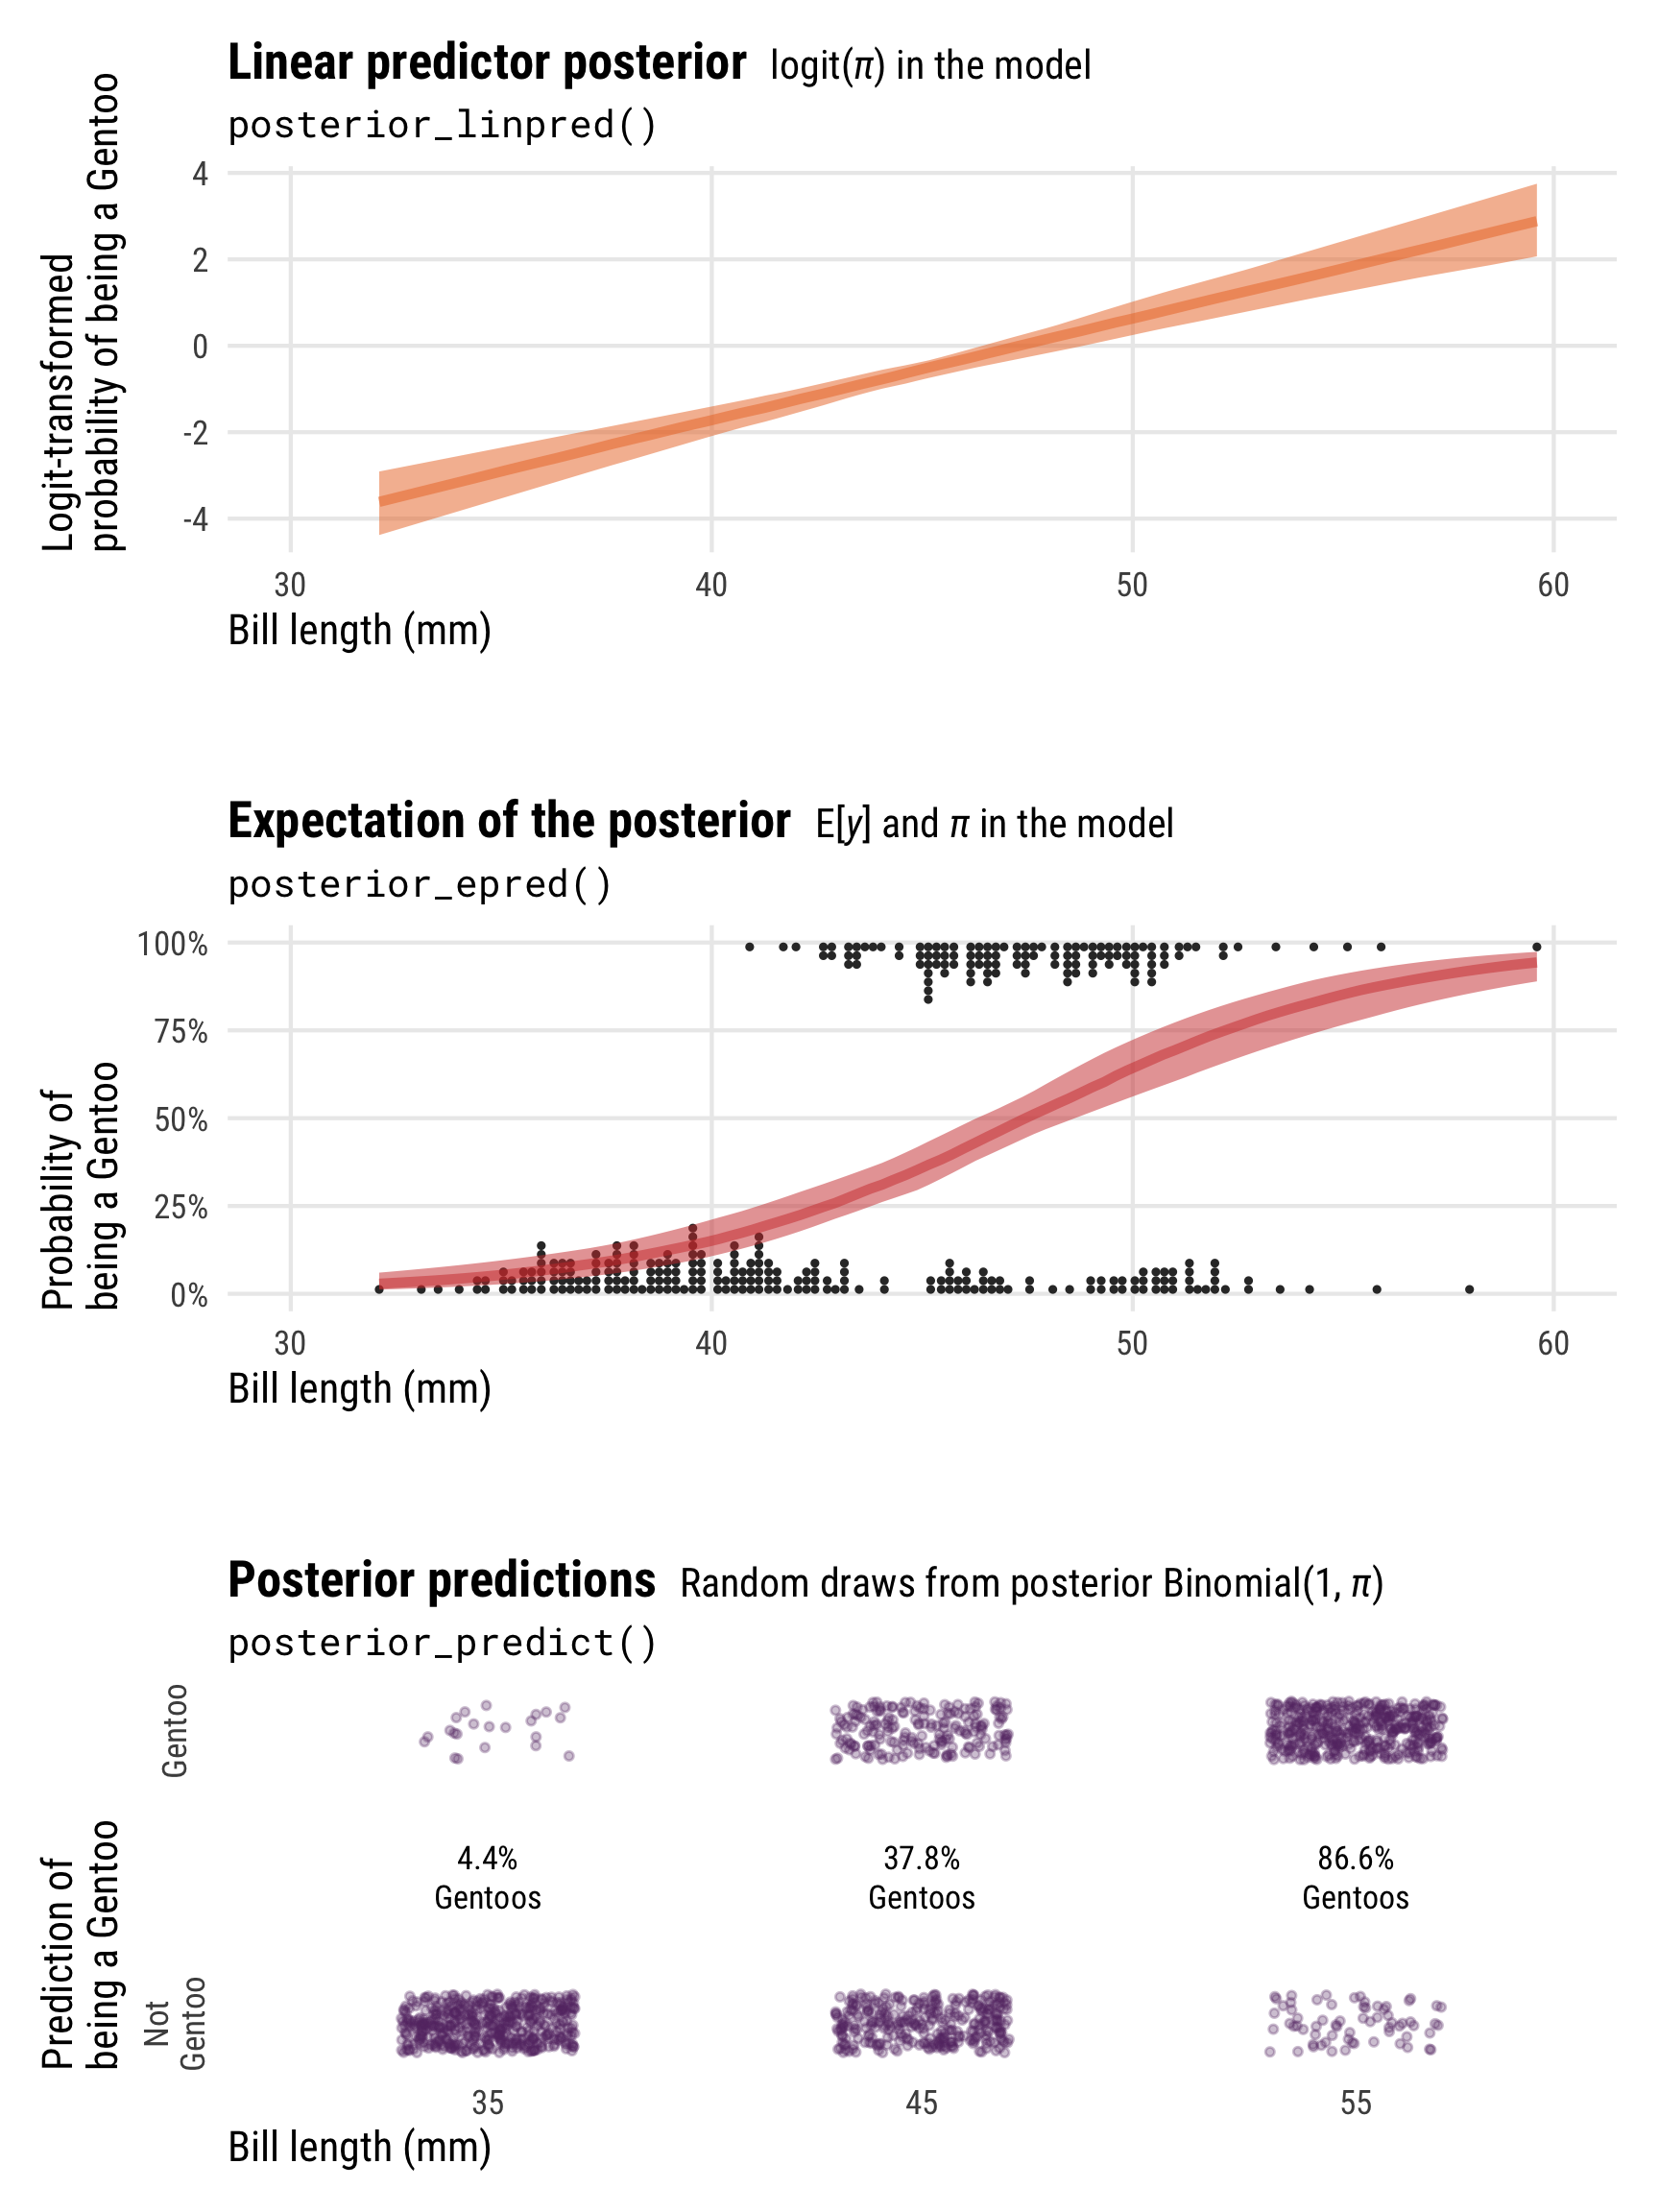
A guide to different types of Bayesian posterior distributions and the nuances of posterior_predict, posterior_epred, and posterior_linpred
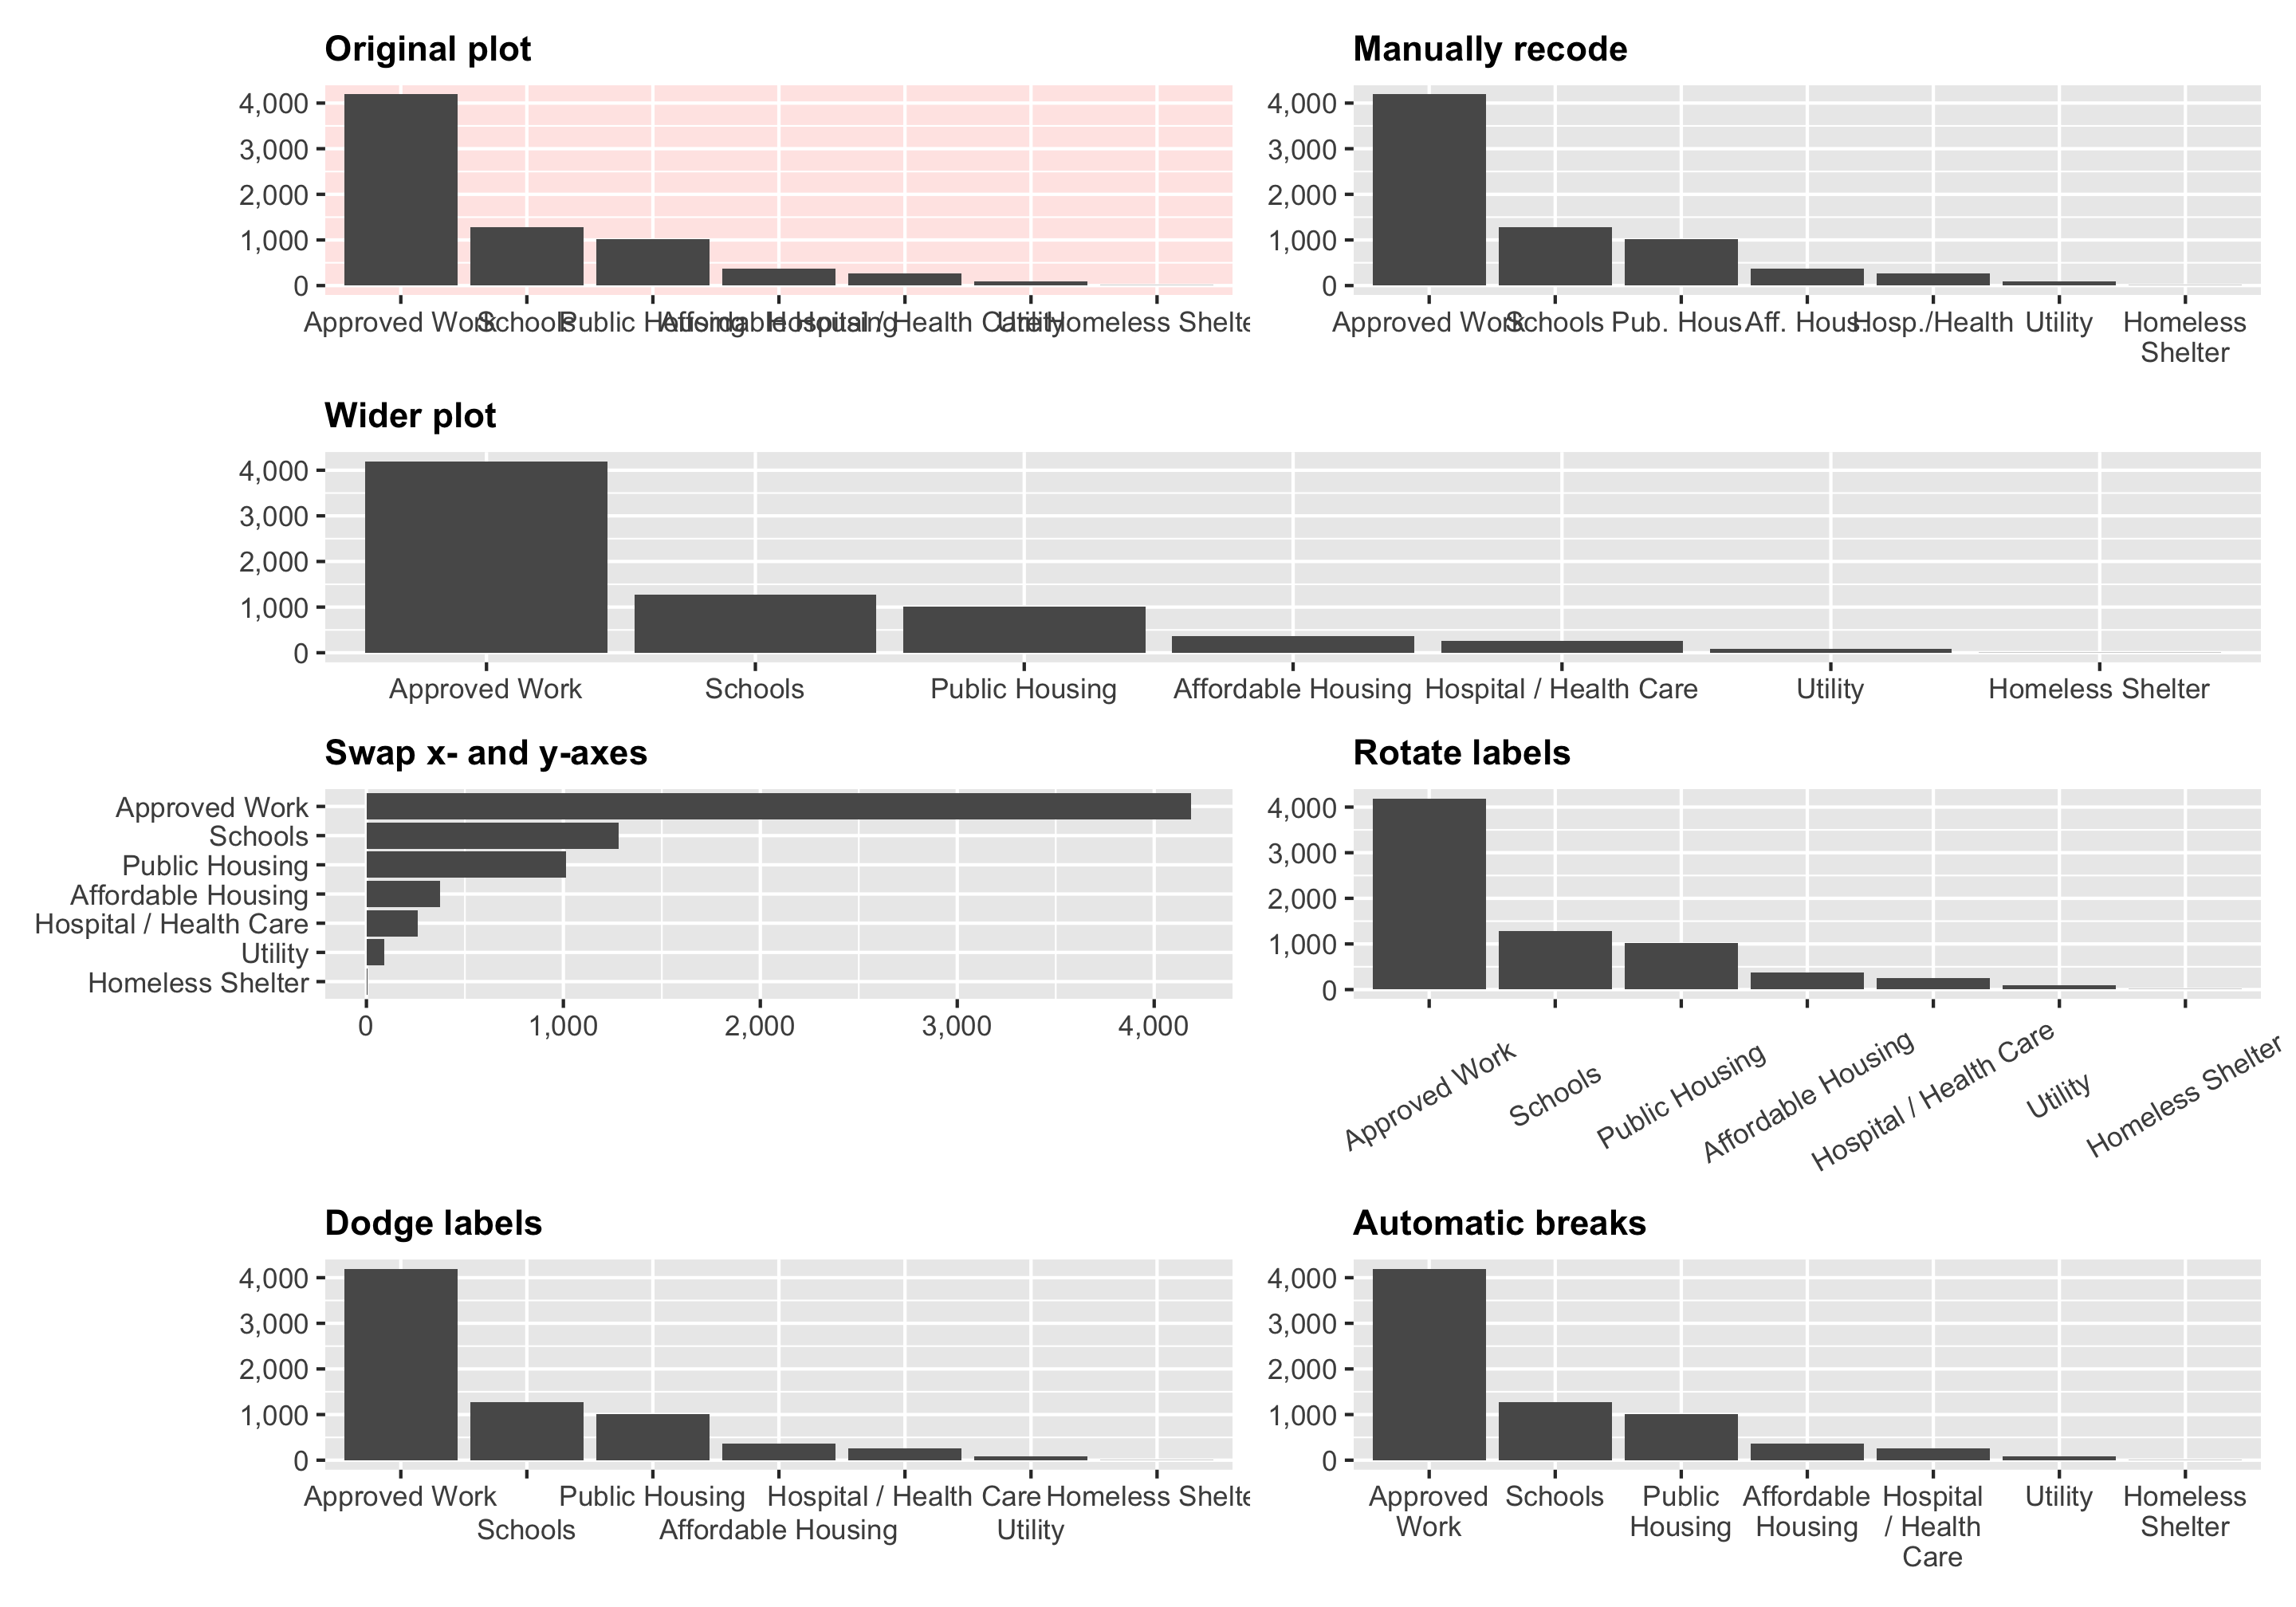
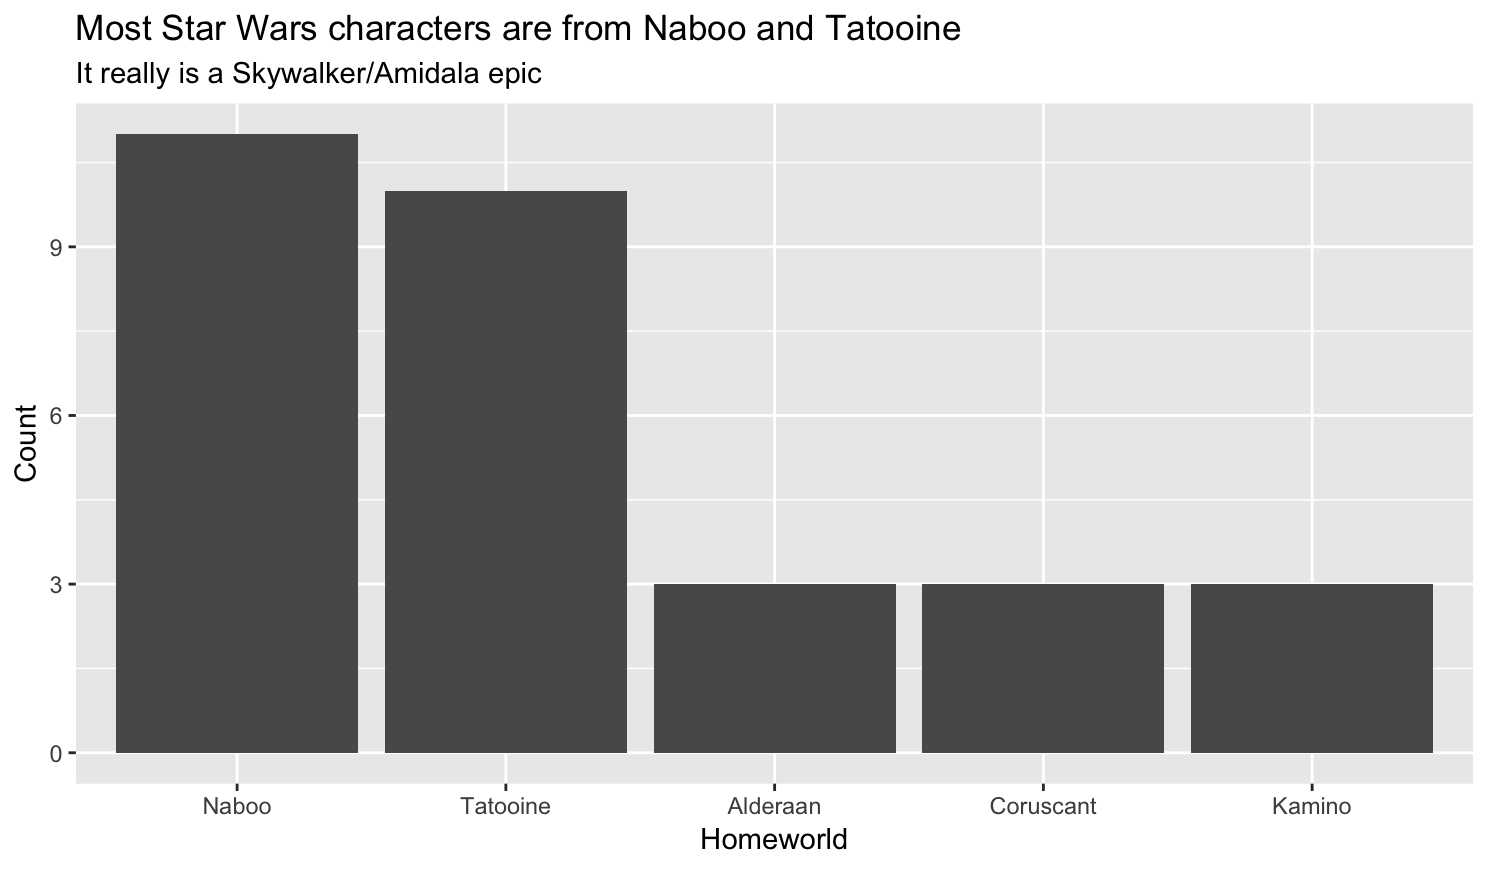
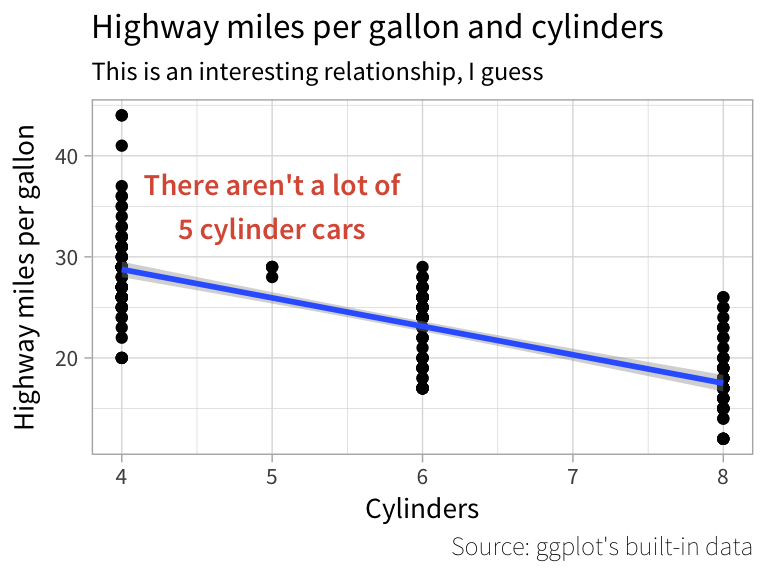
Explore different manual and automatic ways to rotate, dodge, recode, break up, and otherwise deal with long axis labels with ggplot2
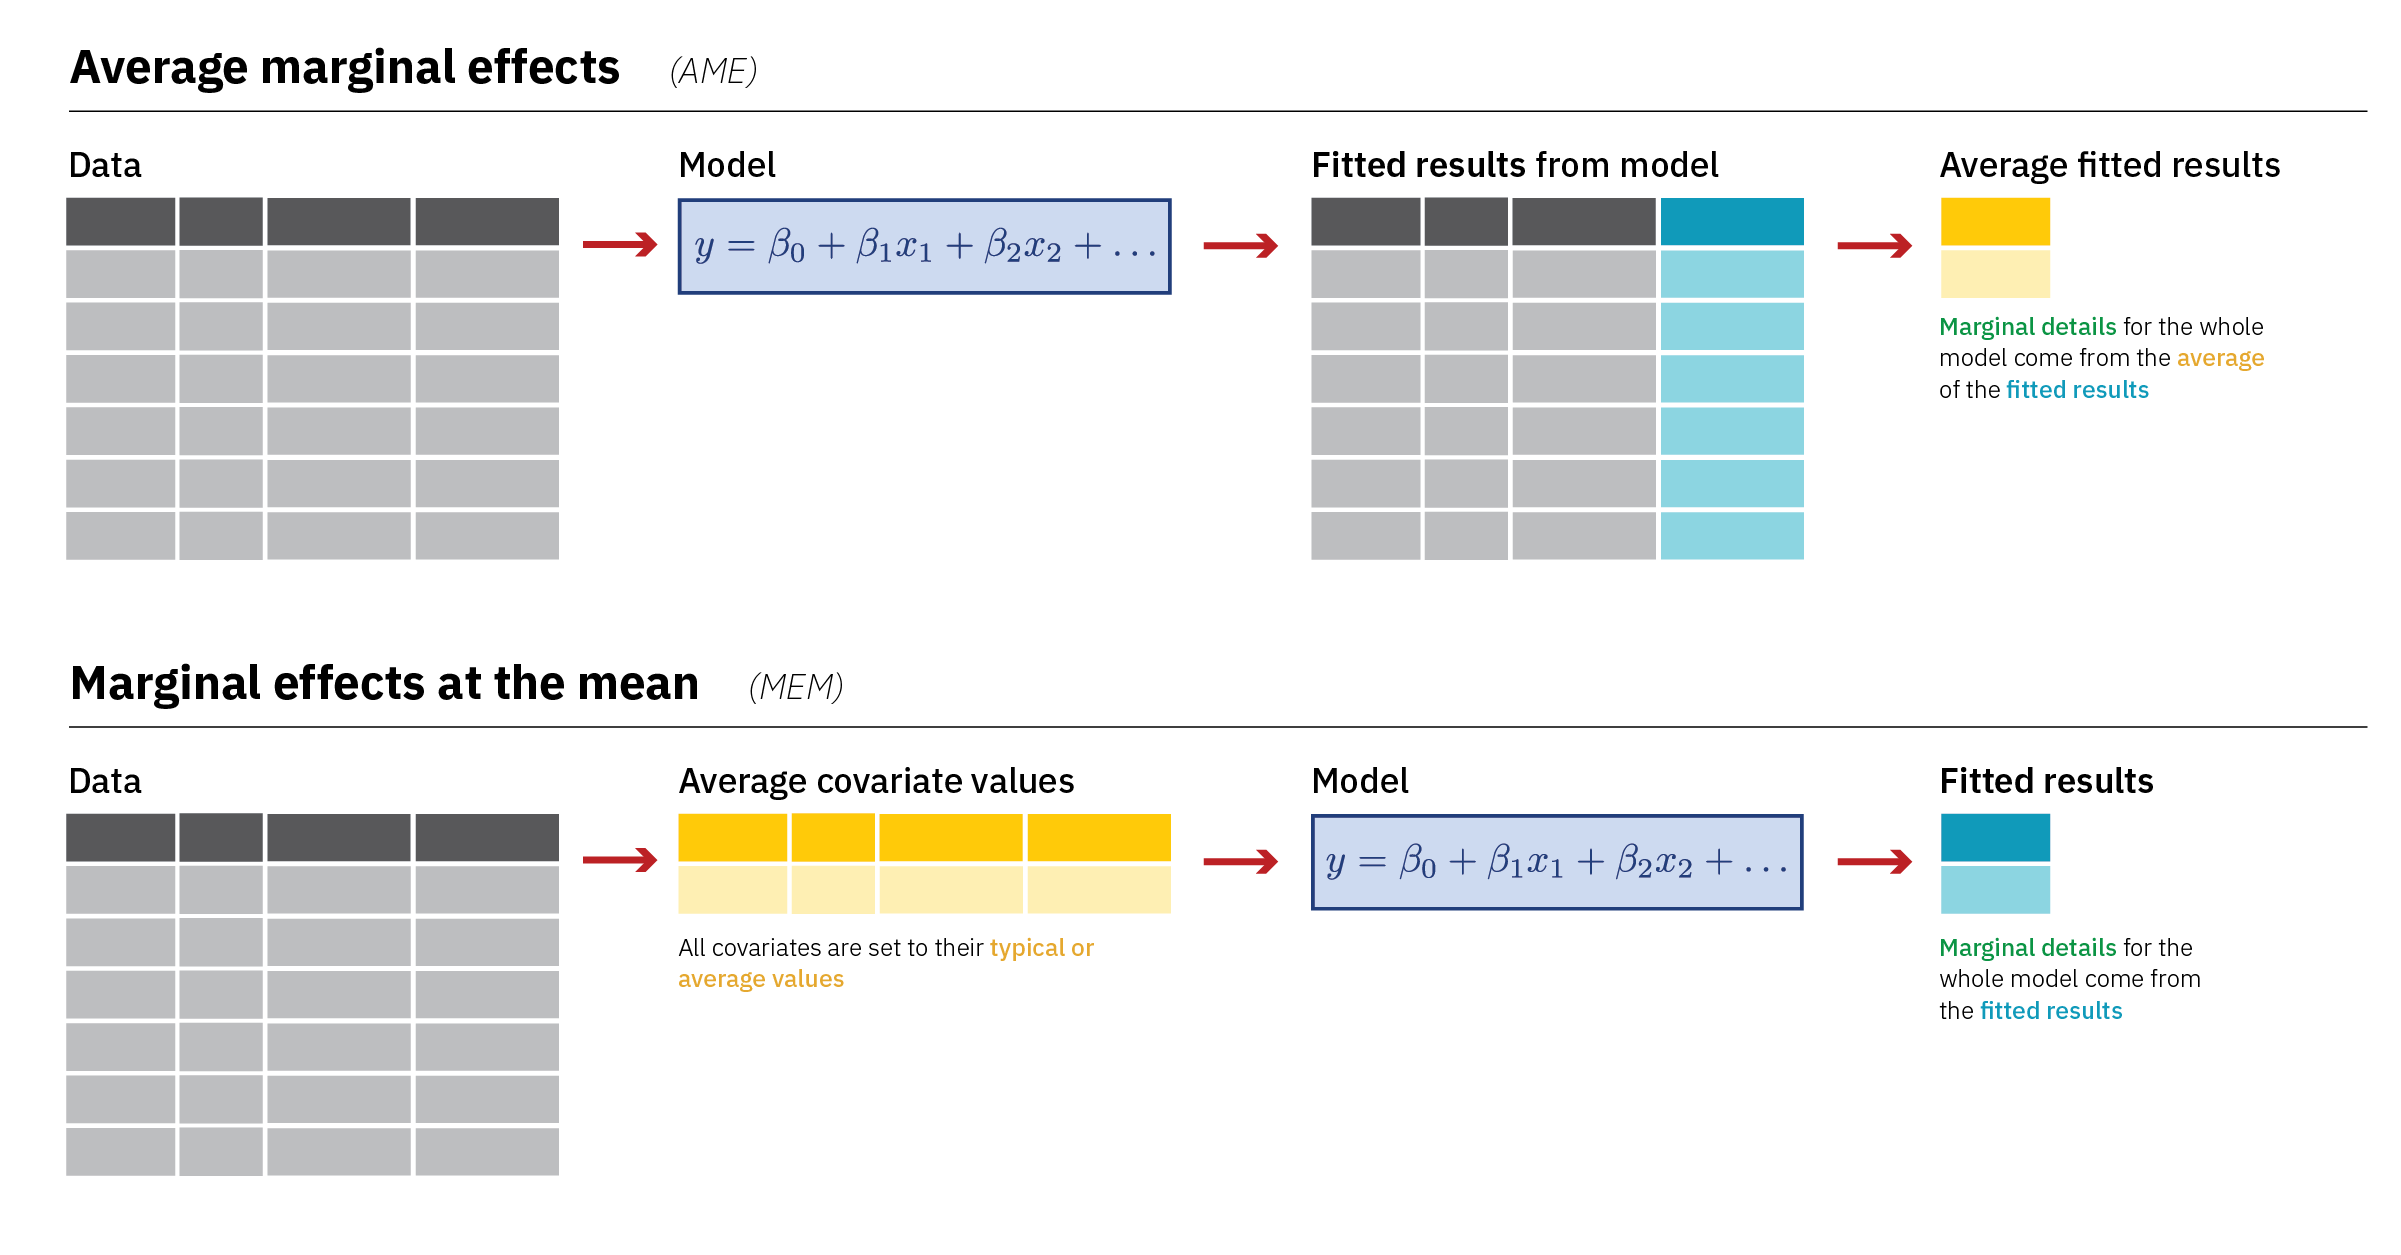
Define what marginal effects even are, and then explore the subtle differences between average marginal effects, marginal effects at the mean, and marginal effects at representative values with the marginaleffects and emmeans R packages
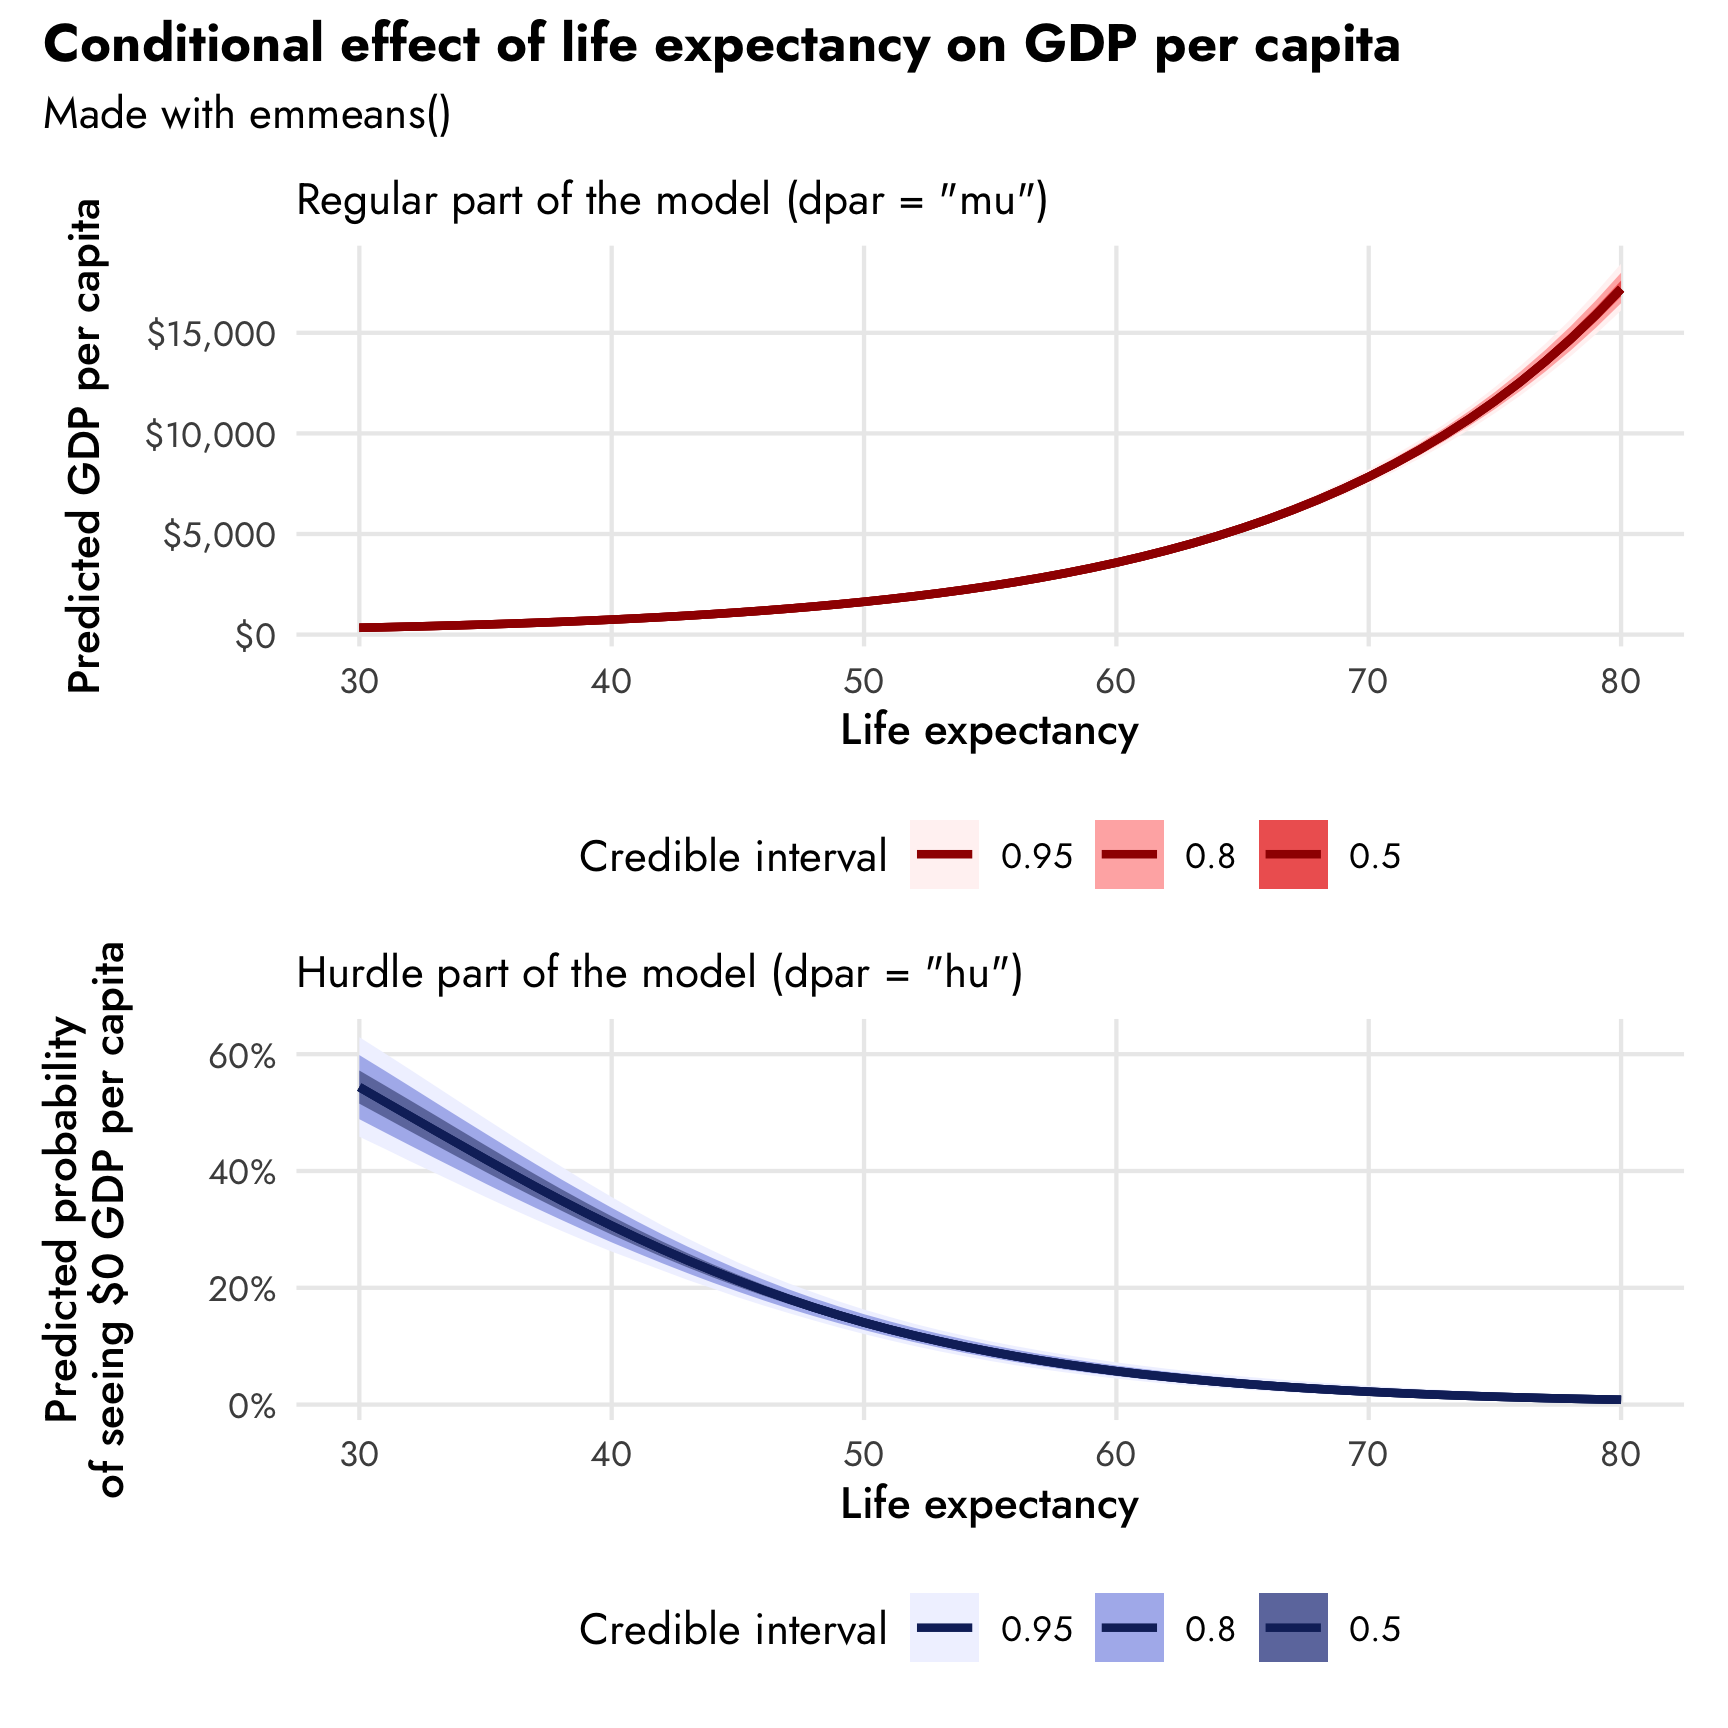
Create, manipulate, understand, analyze, interpret, and plot Bayesian hurdle regression models (and a custom hurdle Gaussian model!) using R, the tidyverse, emmeans, brms, and Stan
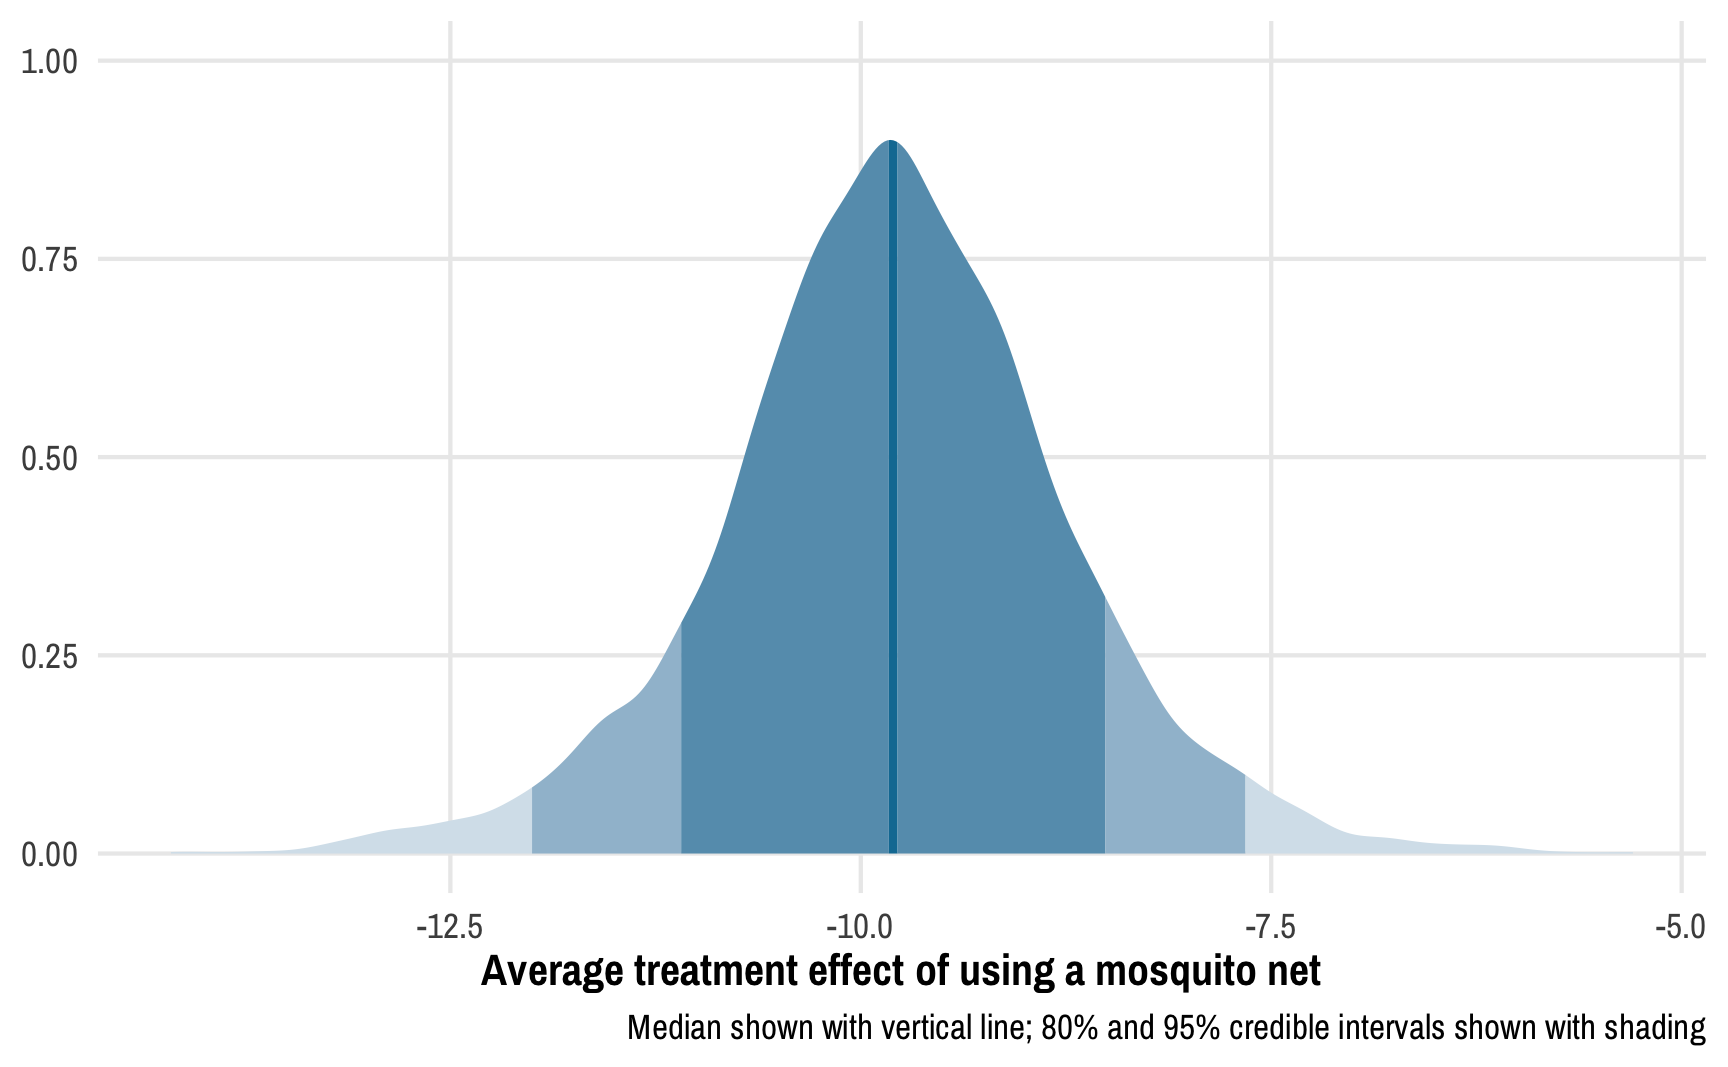
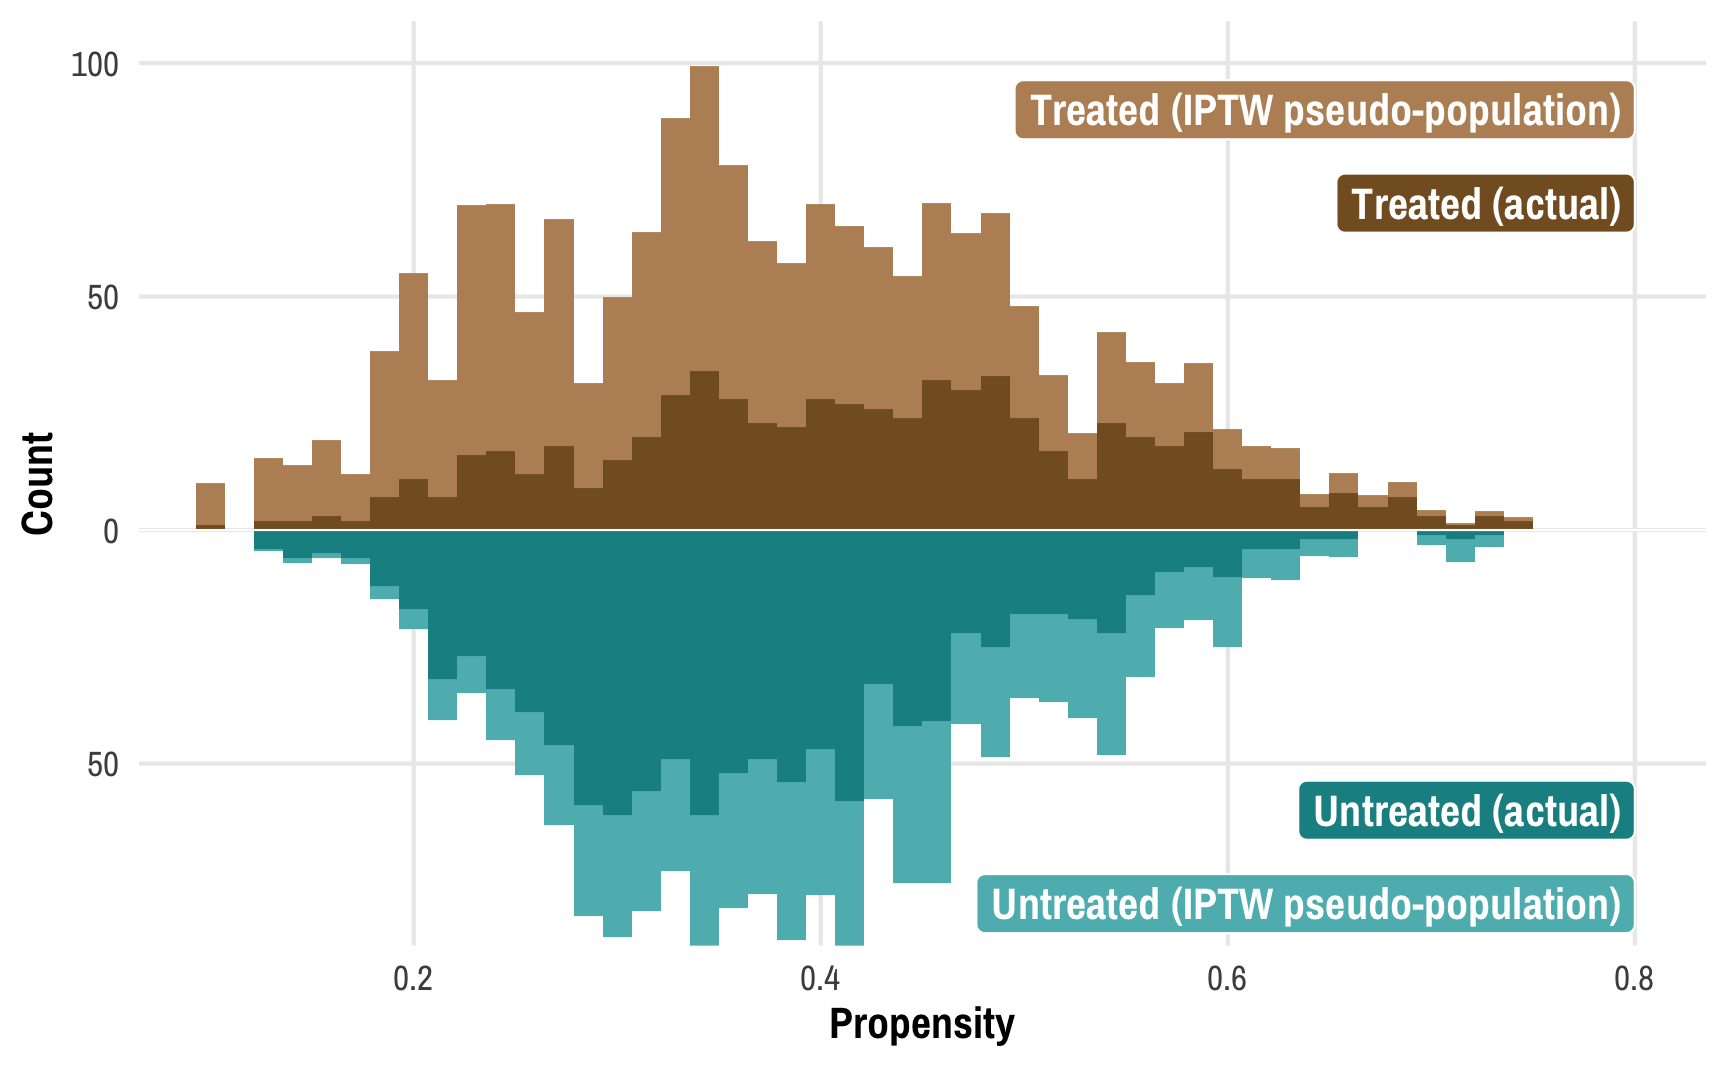
Use a posterior distribution of inverse probability weights in a Bayesian outcome model to conduct (nearly) fully Bayesian causal inference with R, brms, and Stan
For mathematical and philosophical reasons, propensity scores and inverse probability weights don’t work in Bayesian inference. But never fear! There’s still a way to do it!
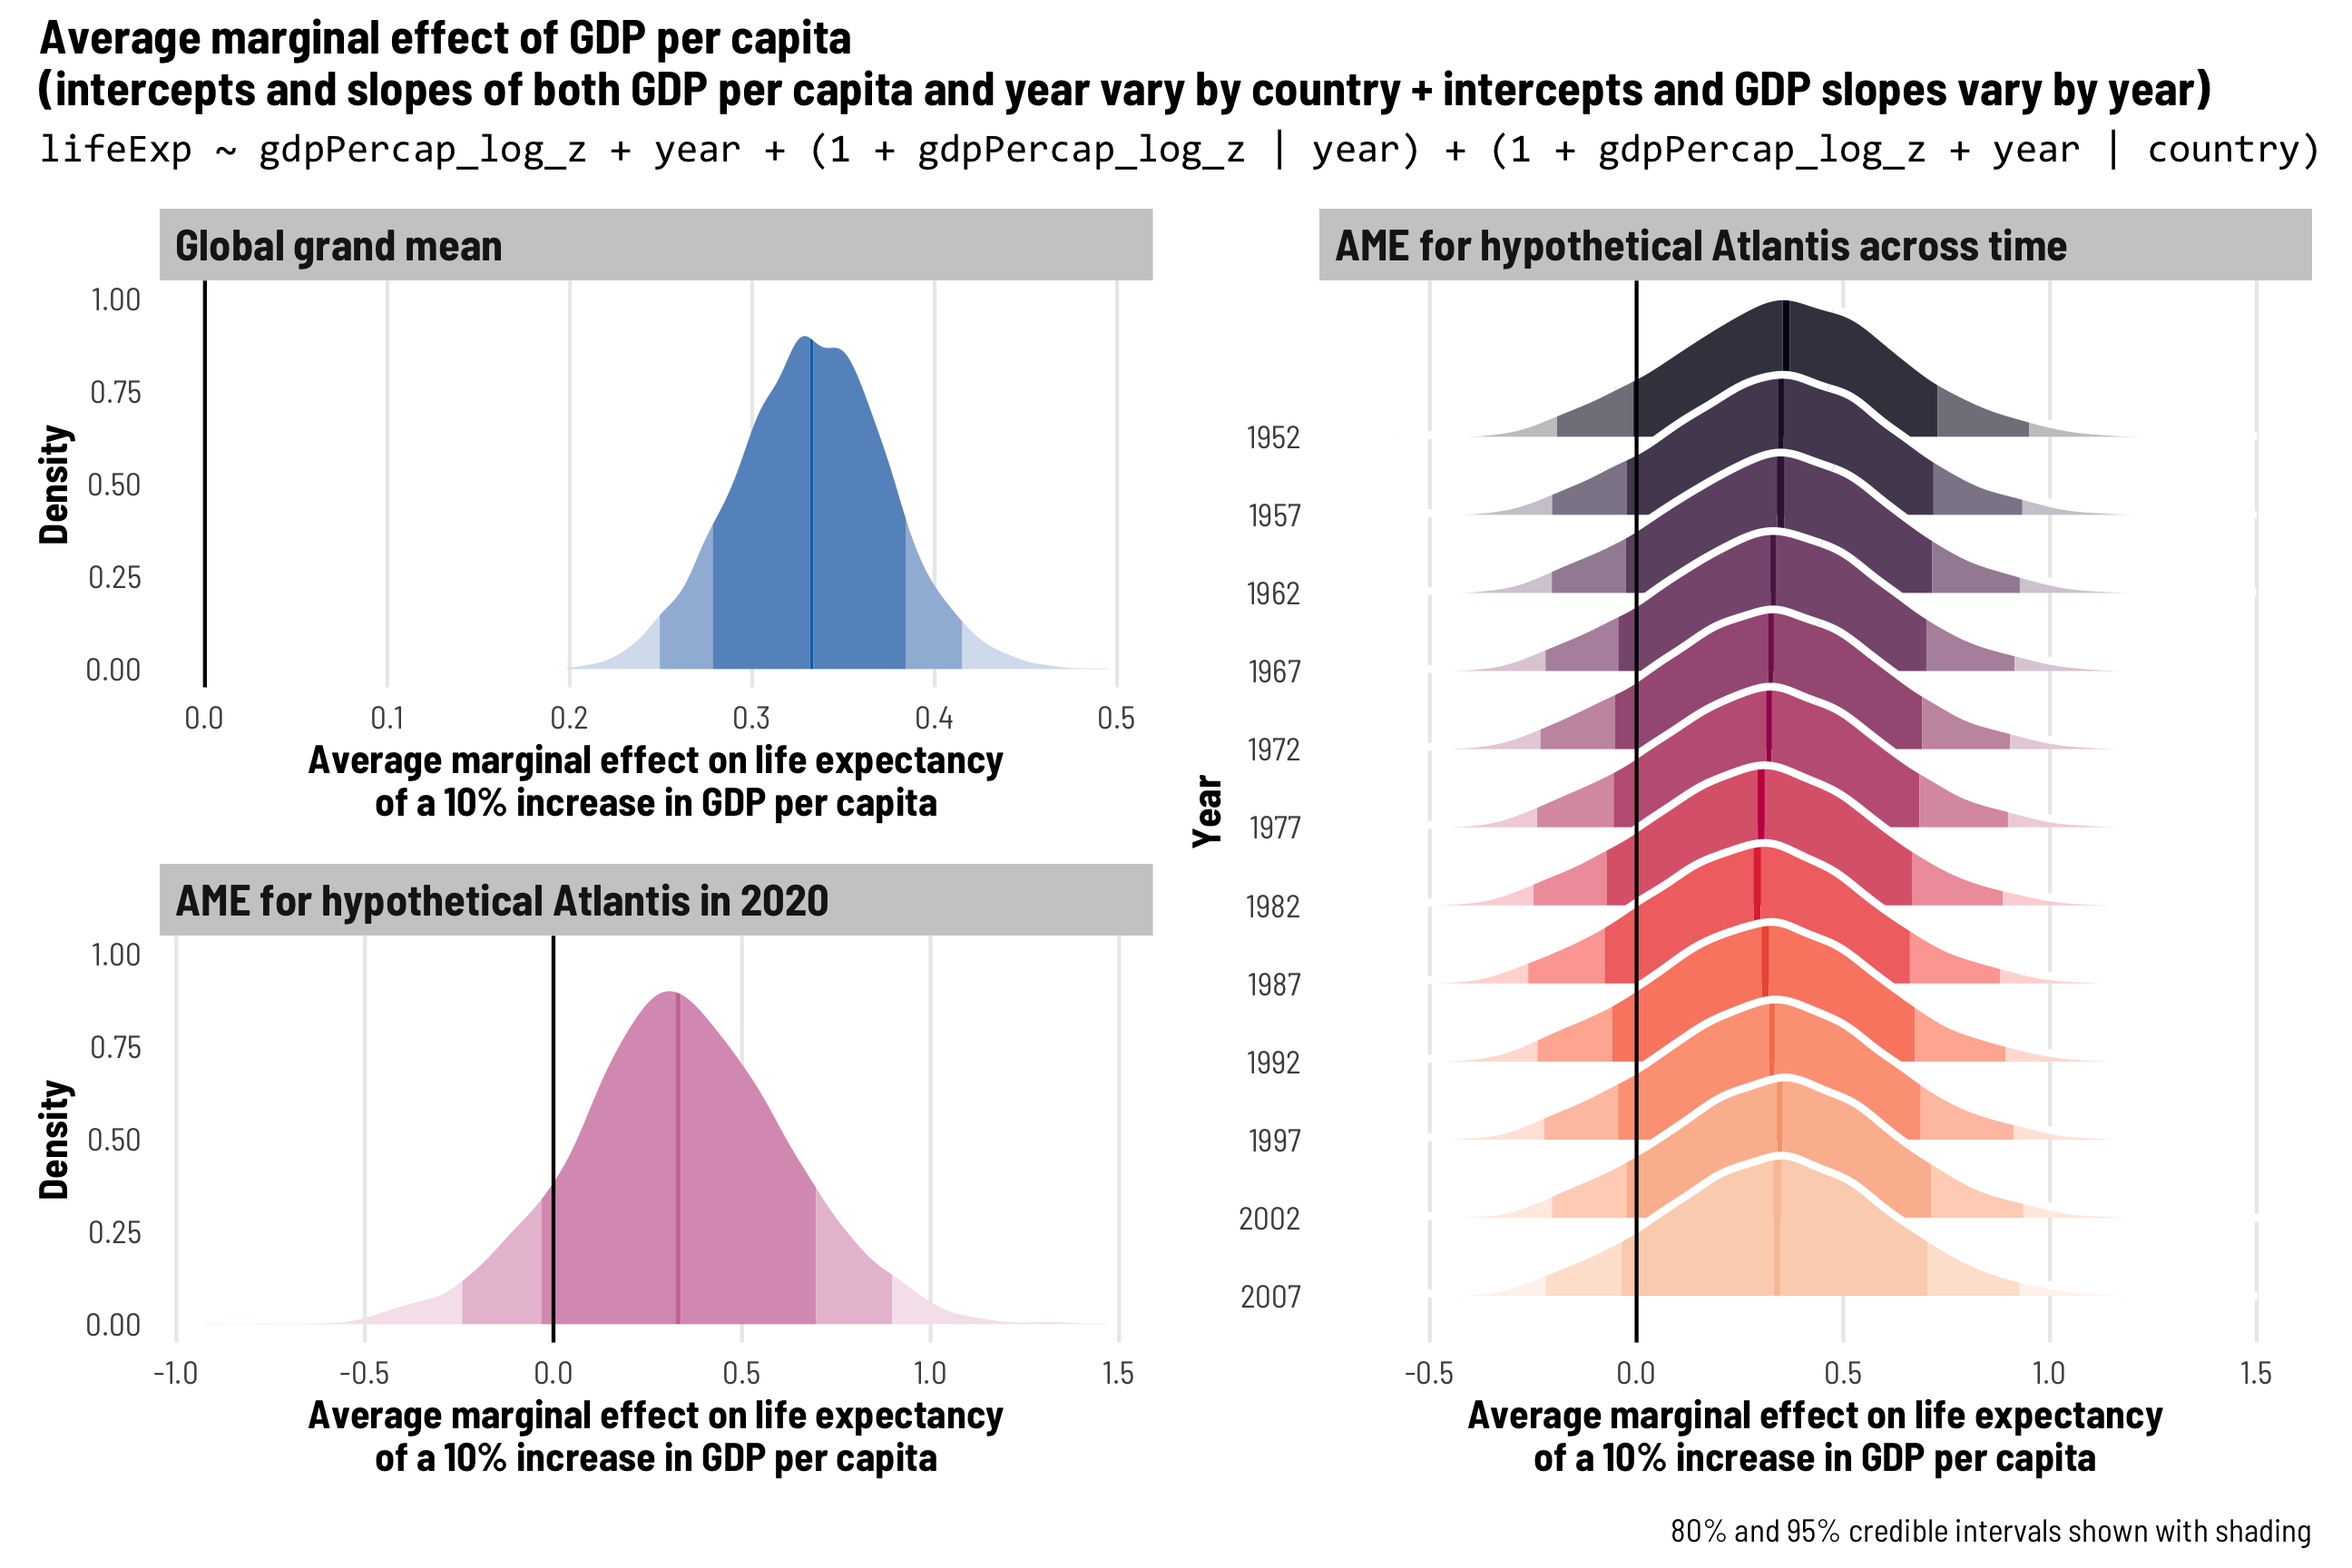
How to use multilevel models with R and brms to work with country-year panel data.
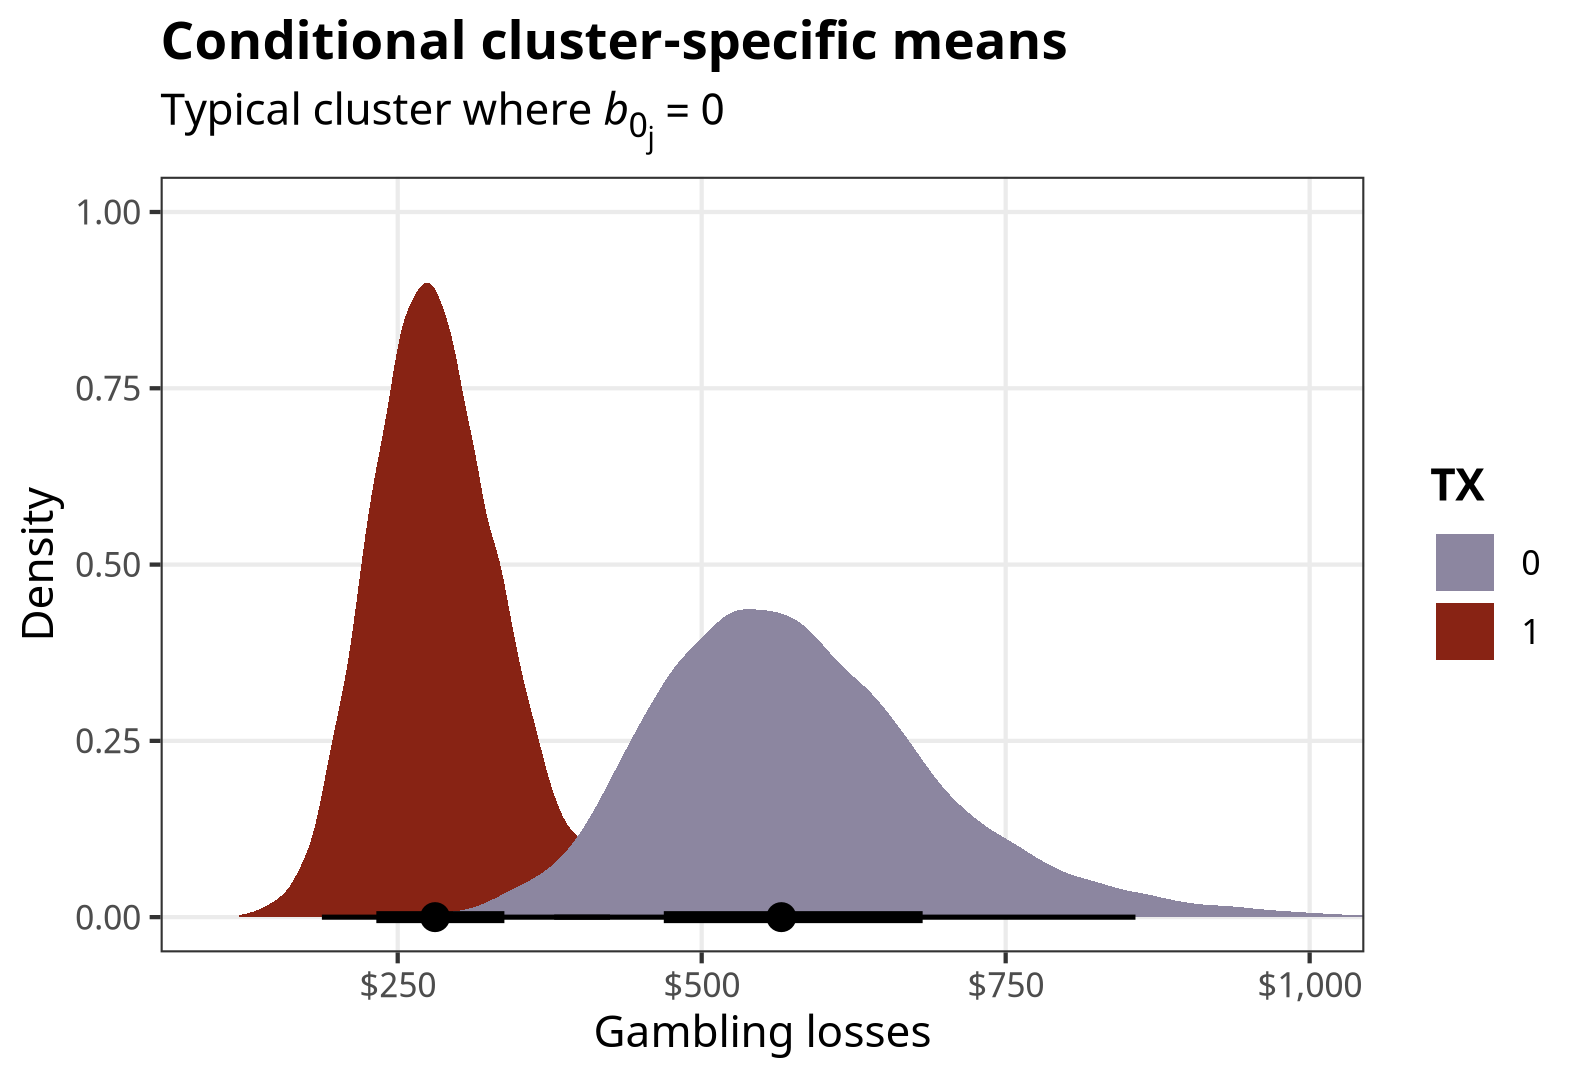
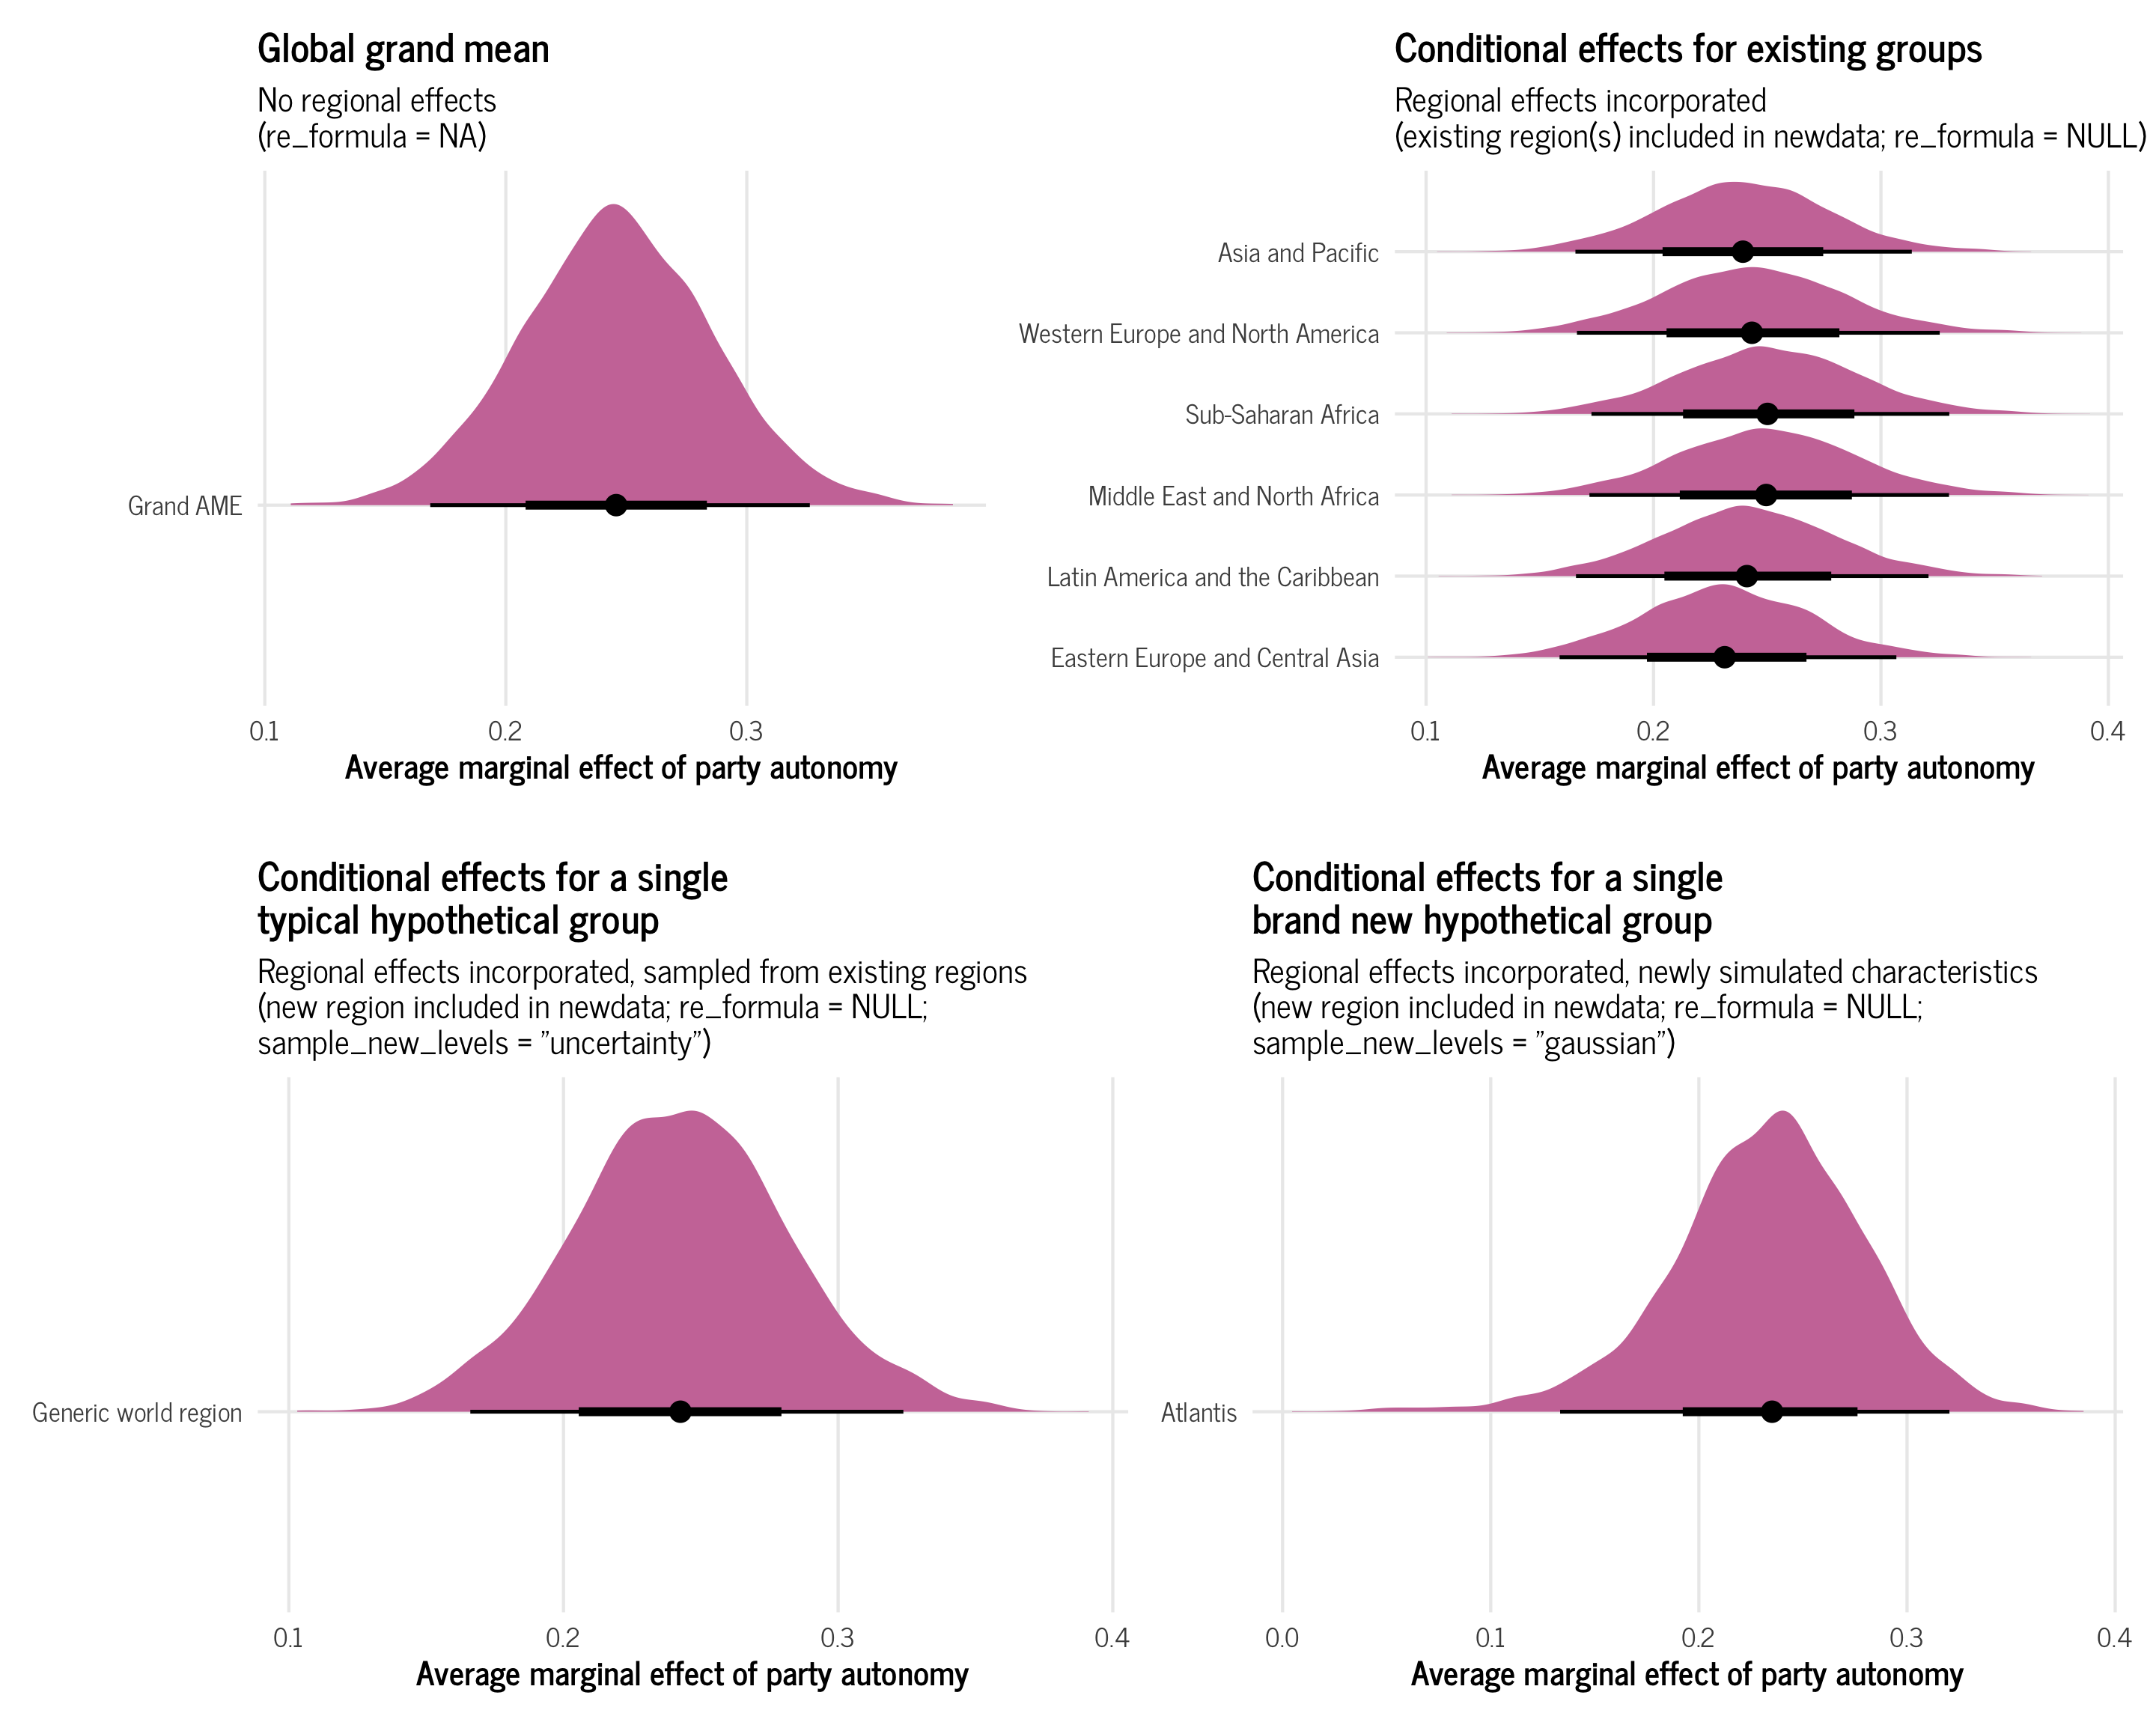
How to calculate grand means, conditional group means, and hypothetical group means of posterior predictions from multilevel brms models.
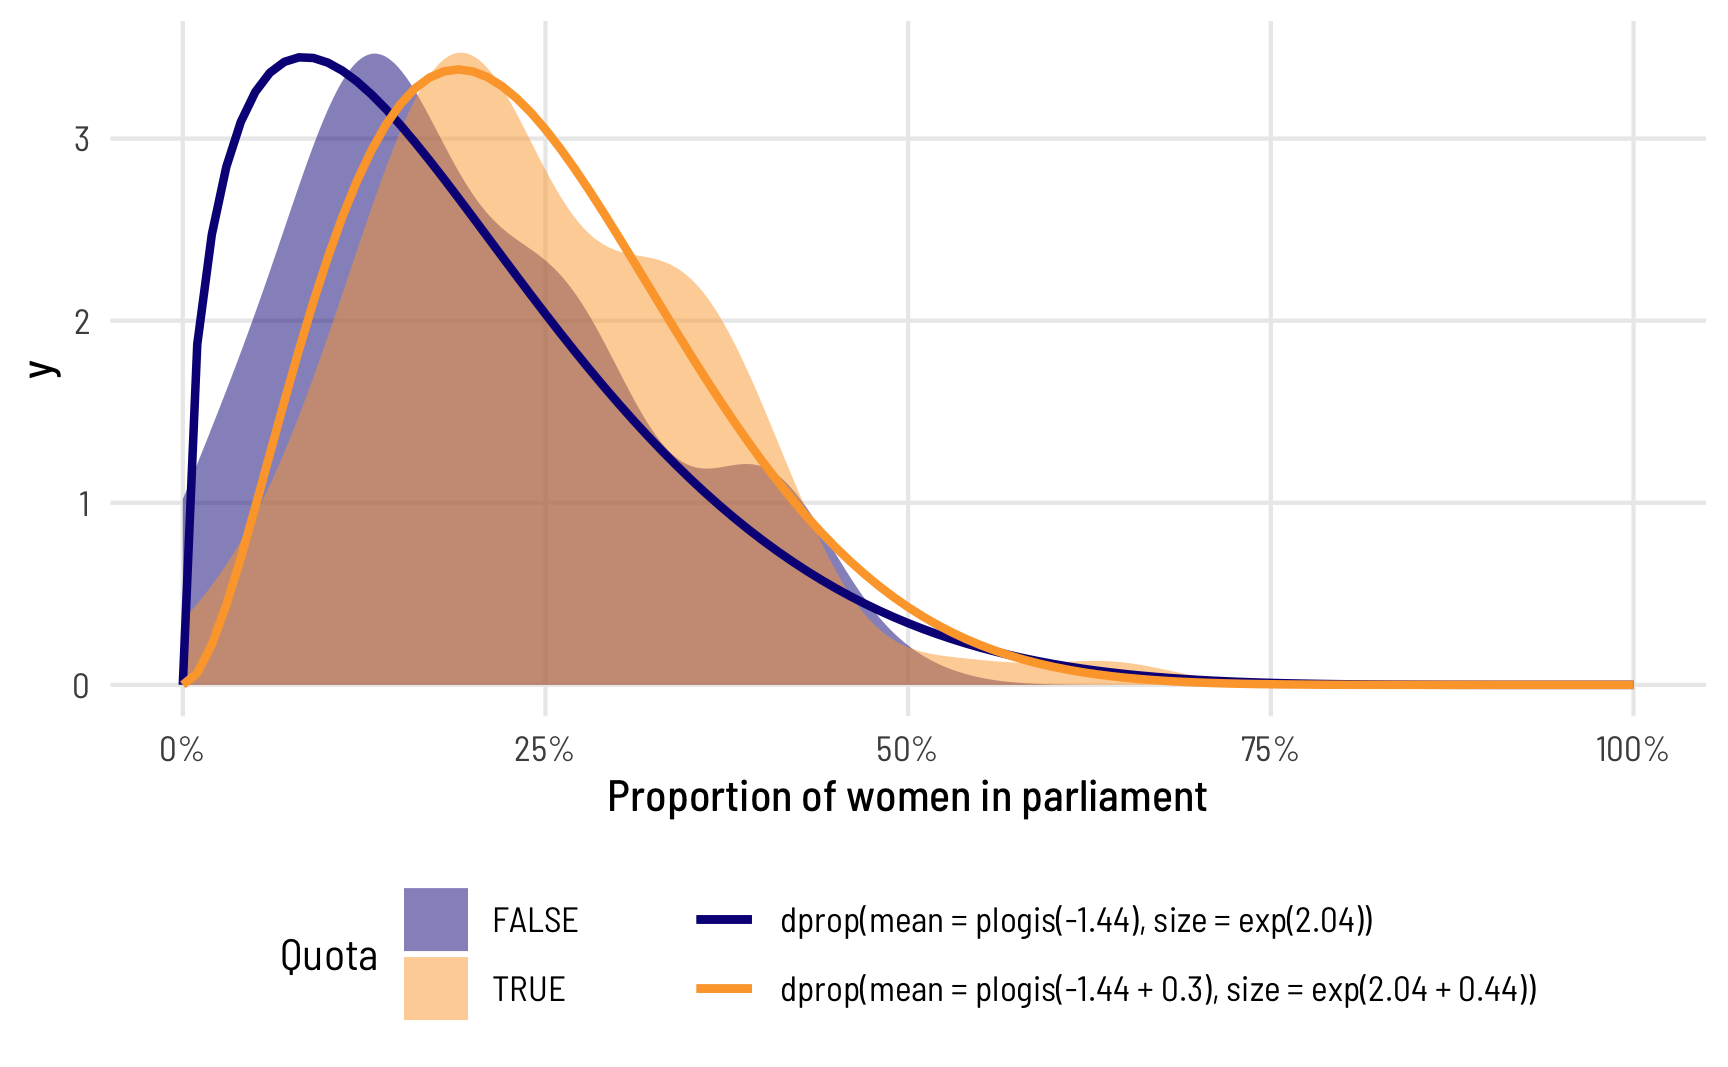
Everything you ever wanted to know about beta regression! Use R and brms to correctly model proportion data, and learn all about the beta distribution along the way.
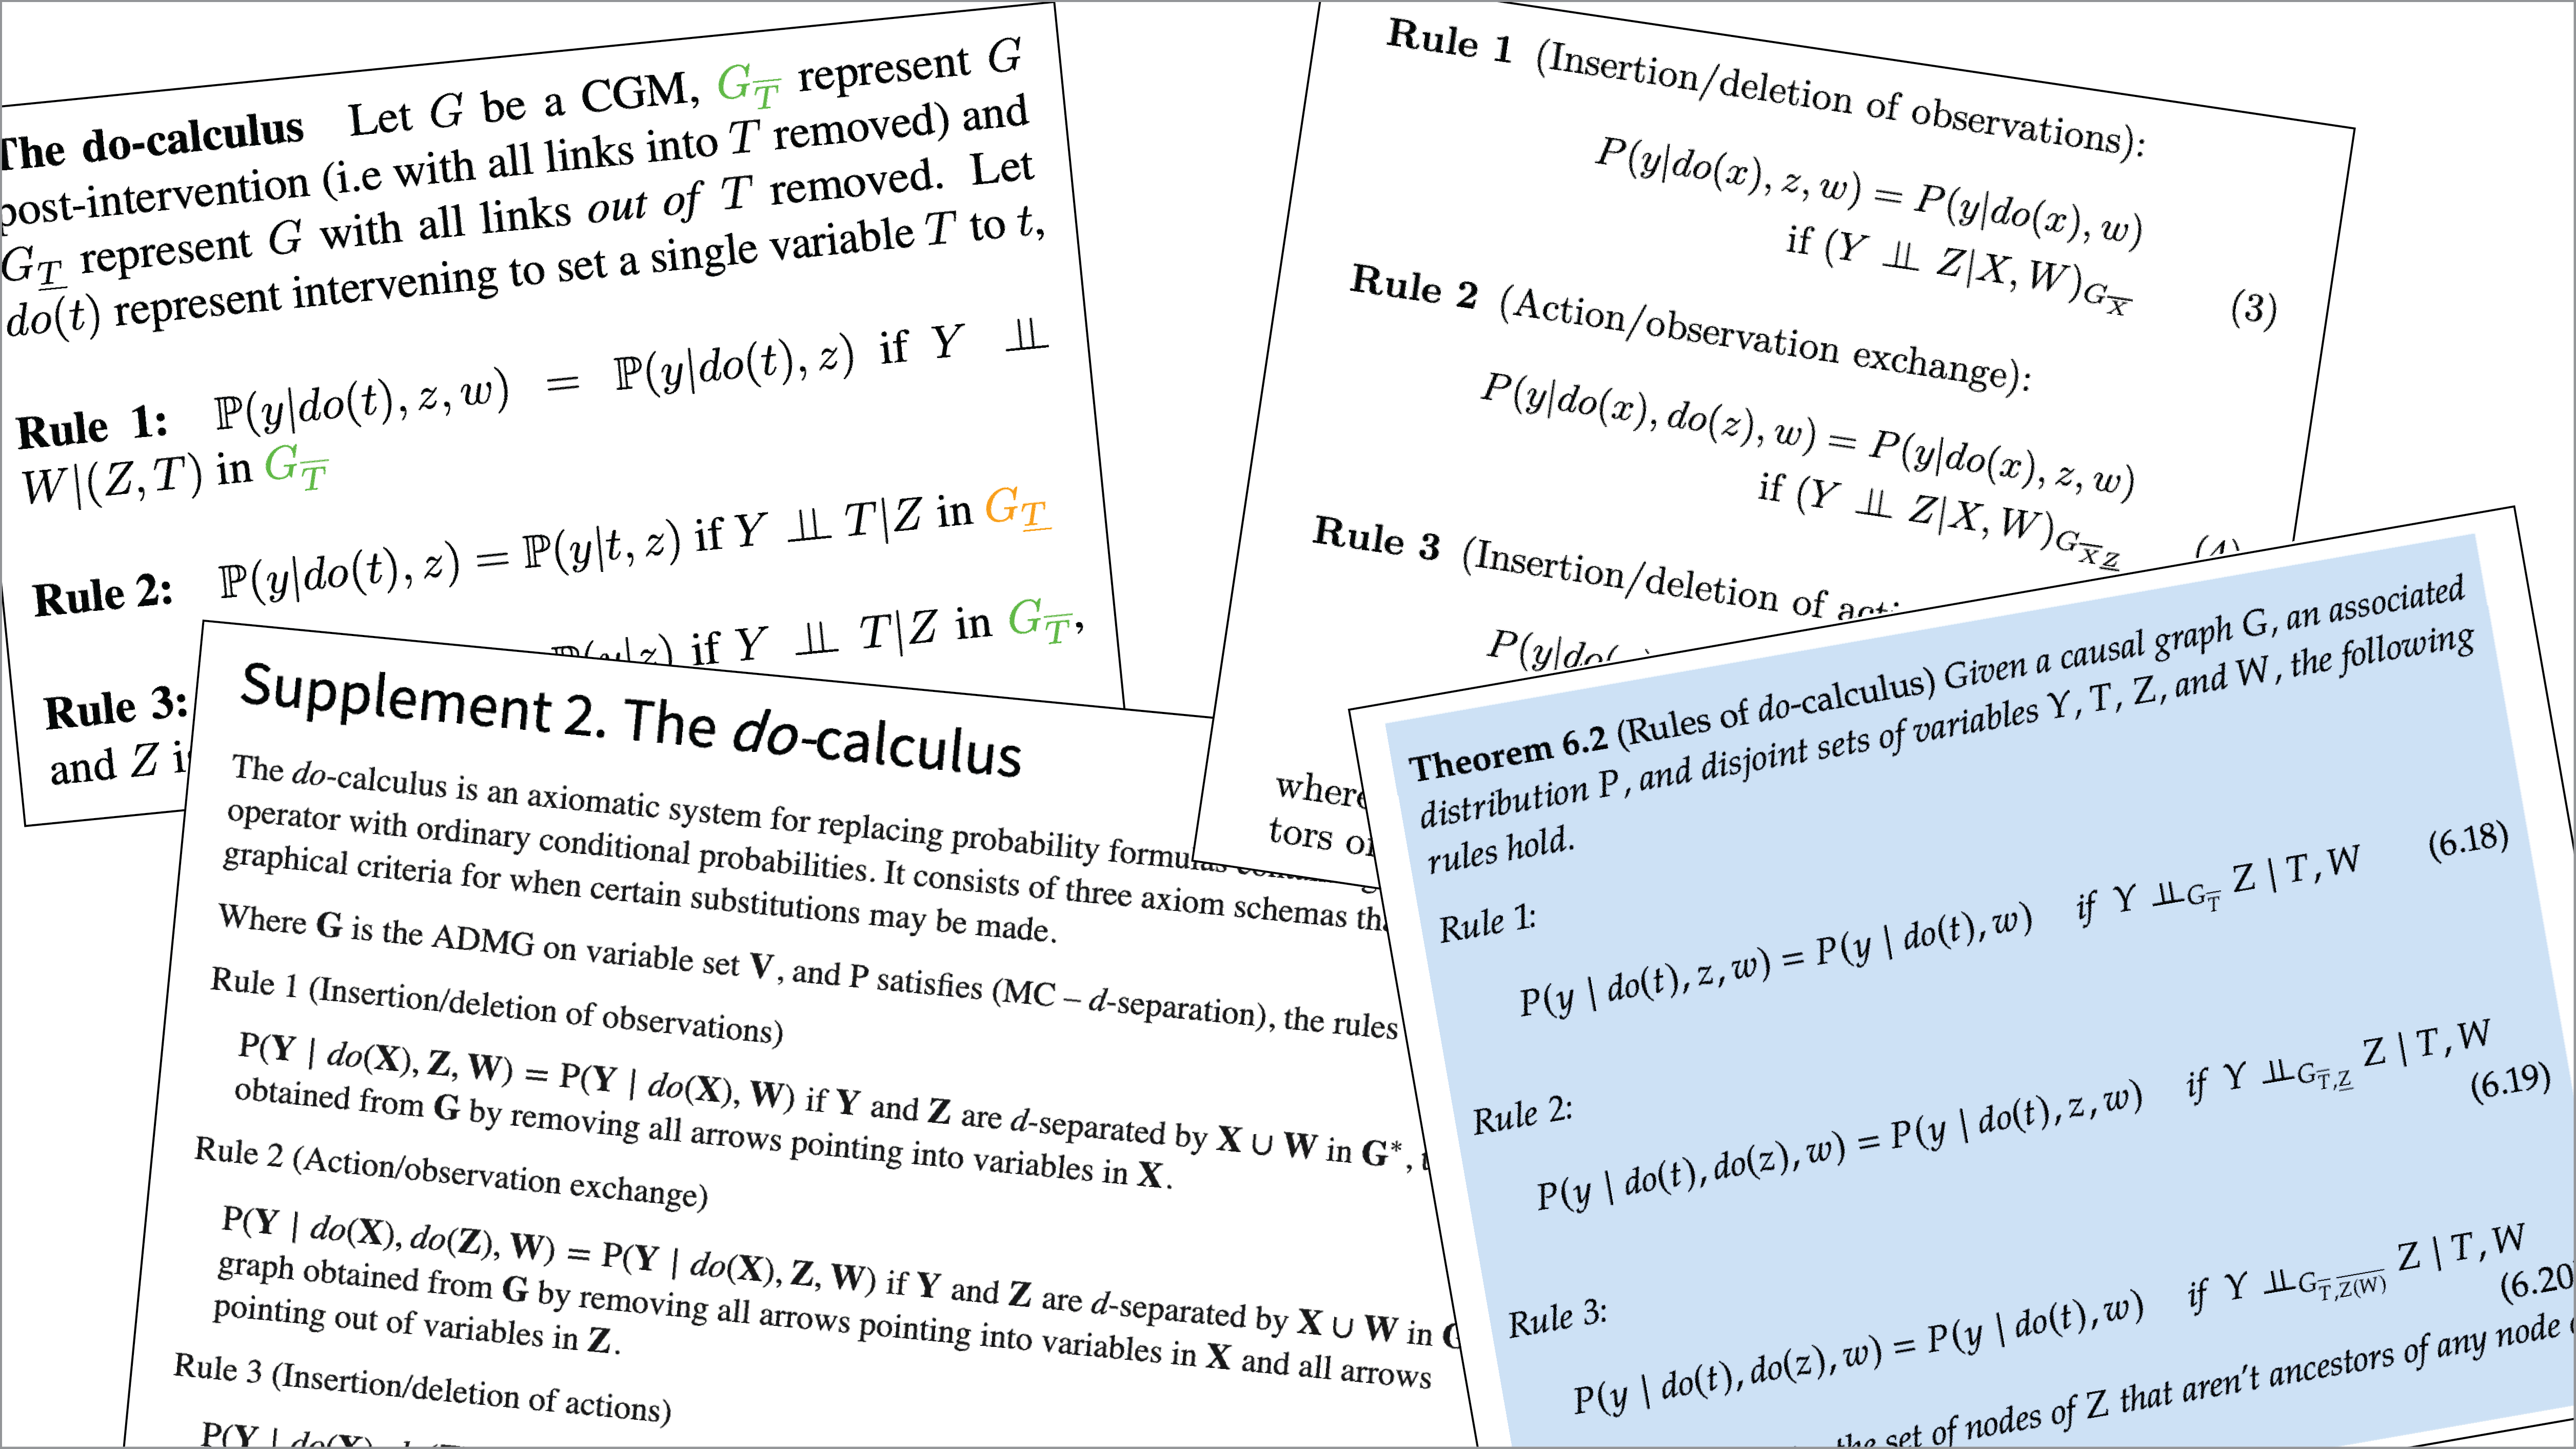
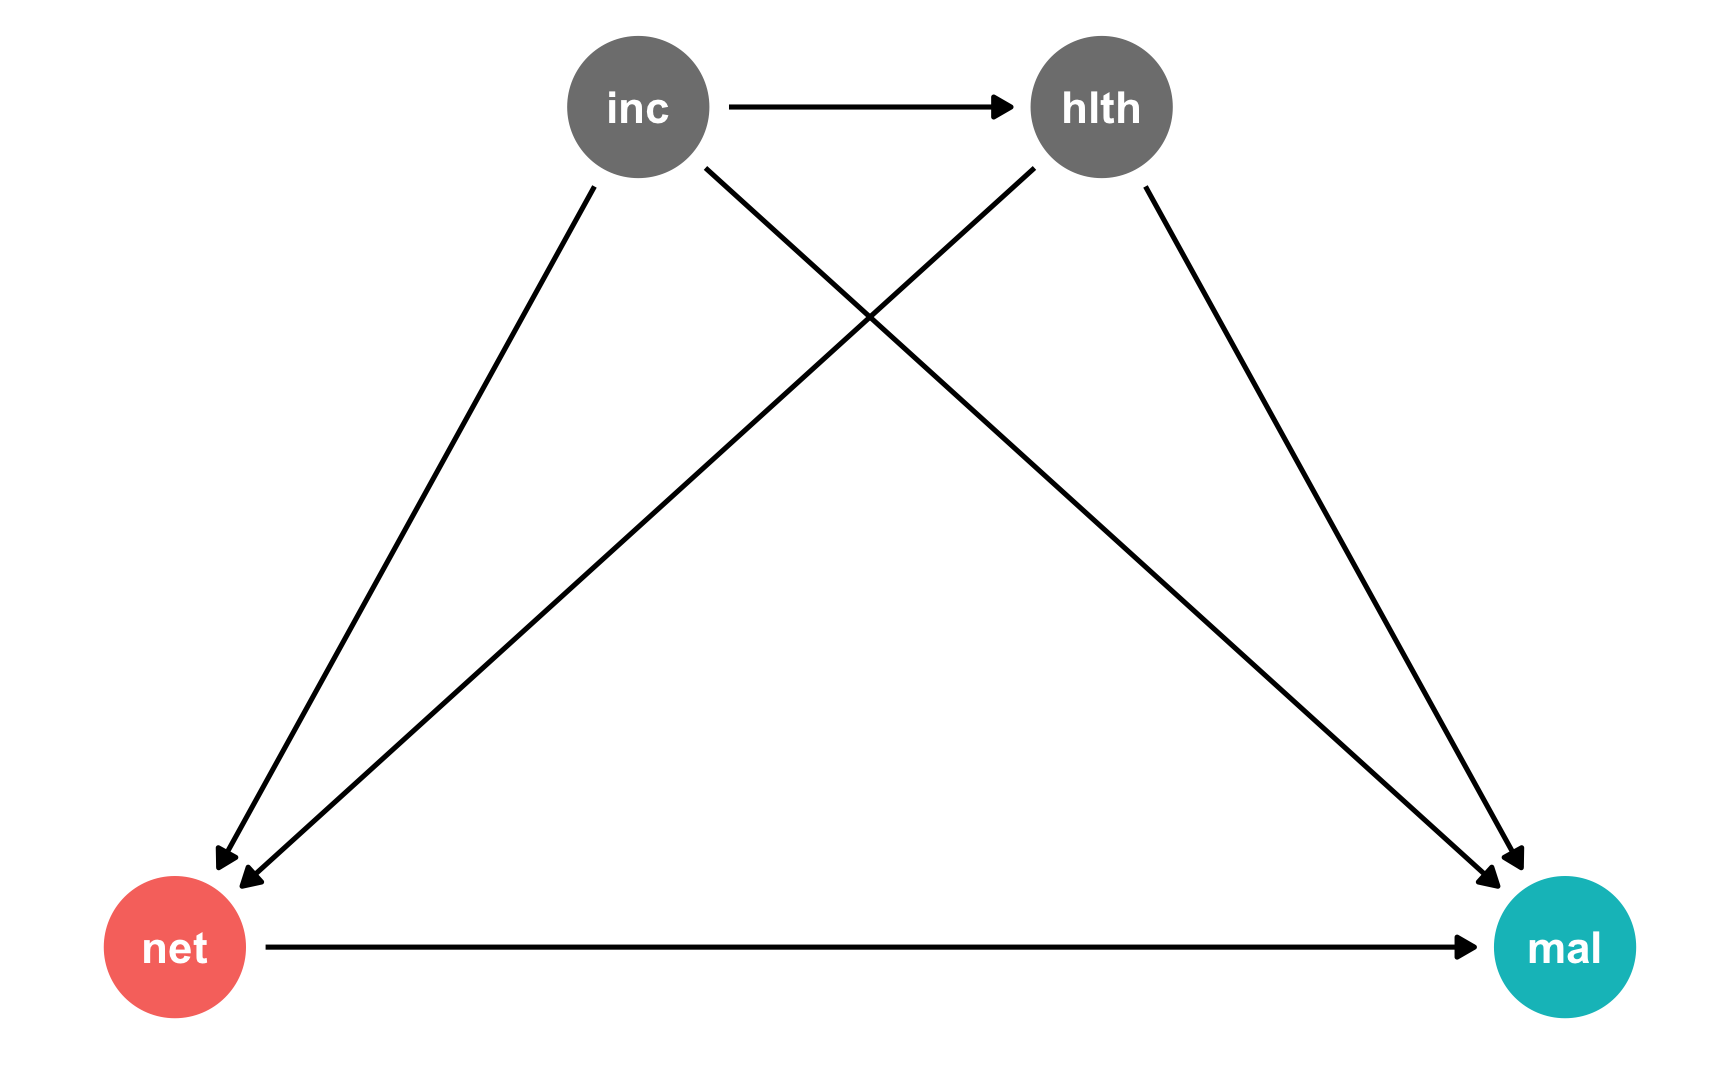
Use R to explore the three rules of do-calculus in plain language and derive the backdoor adjustment formula by hand
Make knitr and R Markdown convert TikZ graphics to font-embedded SVG files when knitting to HTML
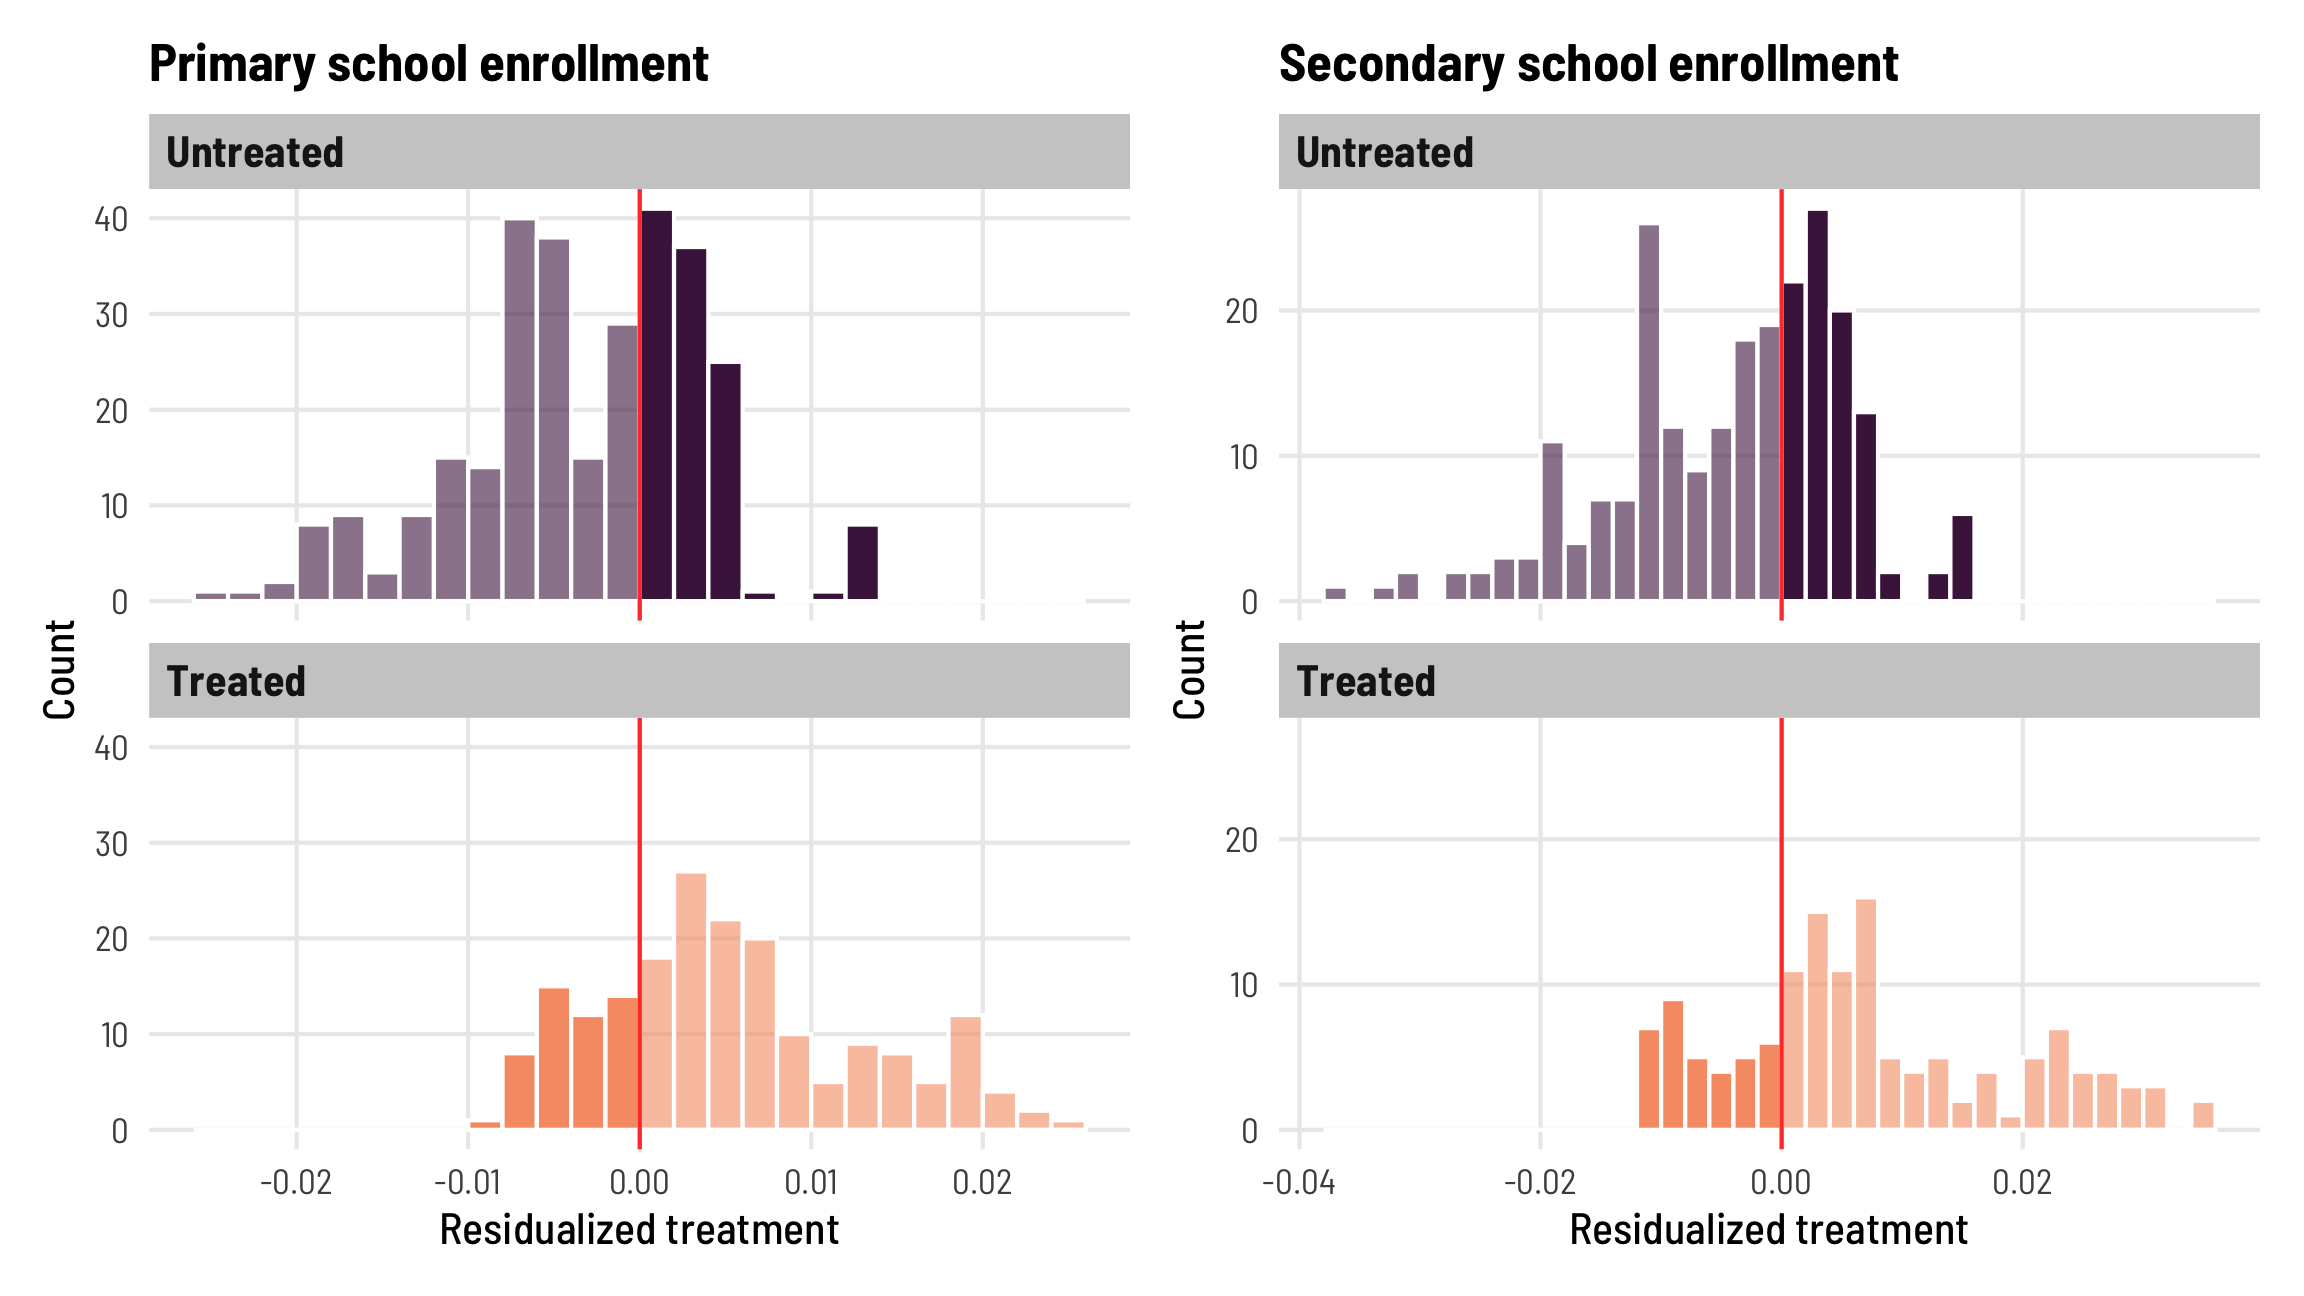
Use R to explore possible biases that come from differential treatment timing in two-way fixed effects (TWFE) regression models
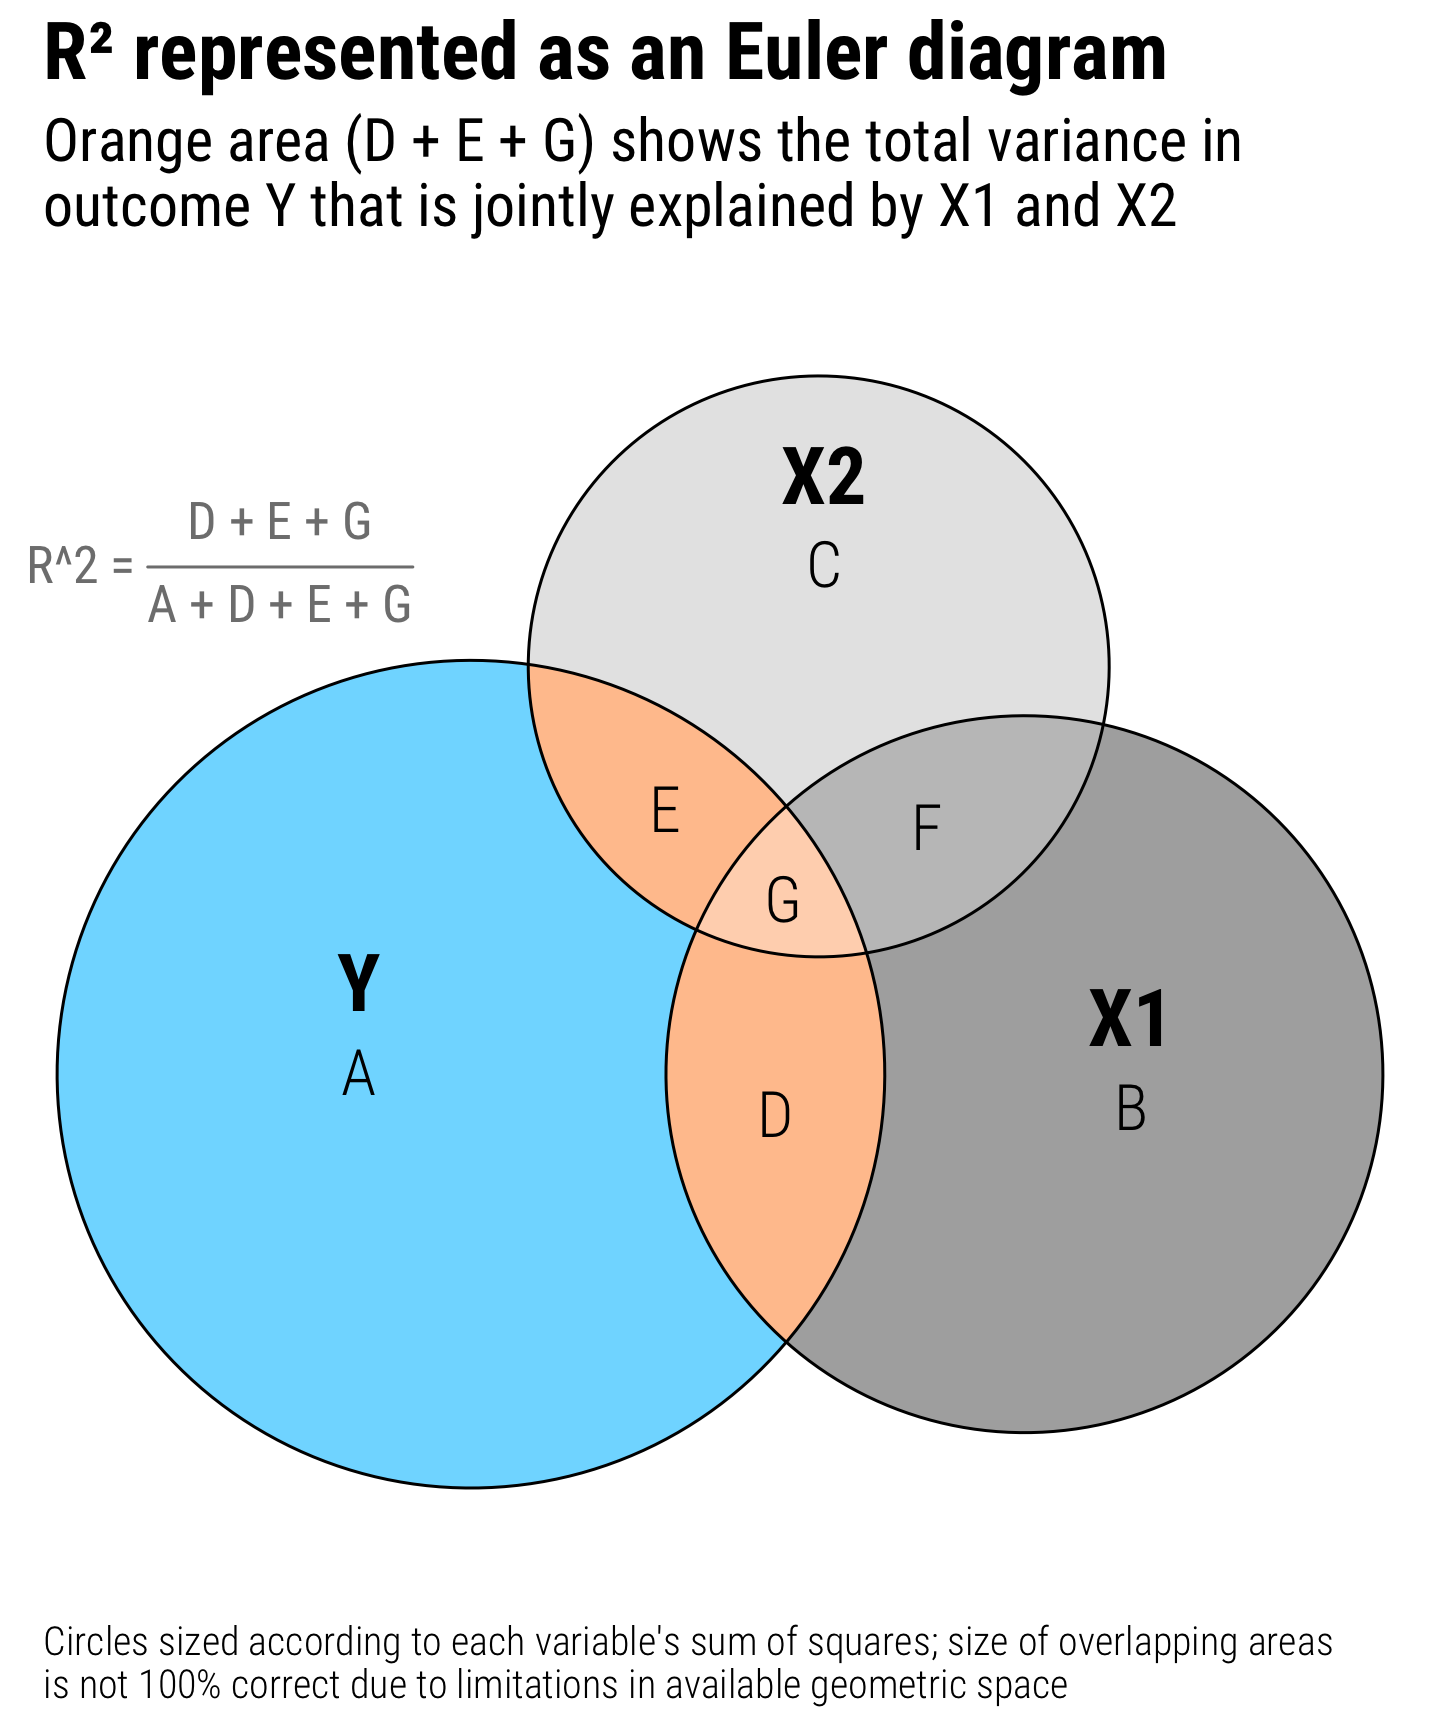
Use Venn diagrams to visualize the proportion of an outcome explained by a regression model
Make your own Ted Lasso AFC Richmond crest cross stitch with a free pattern and an Illustrator template
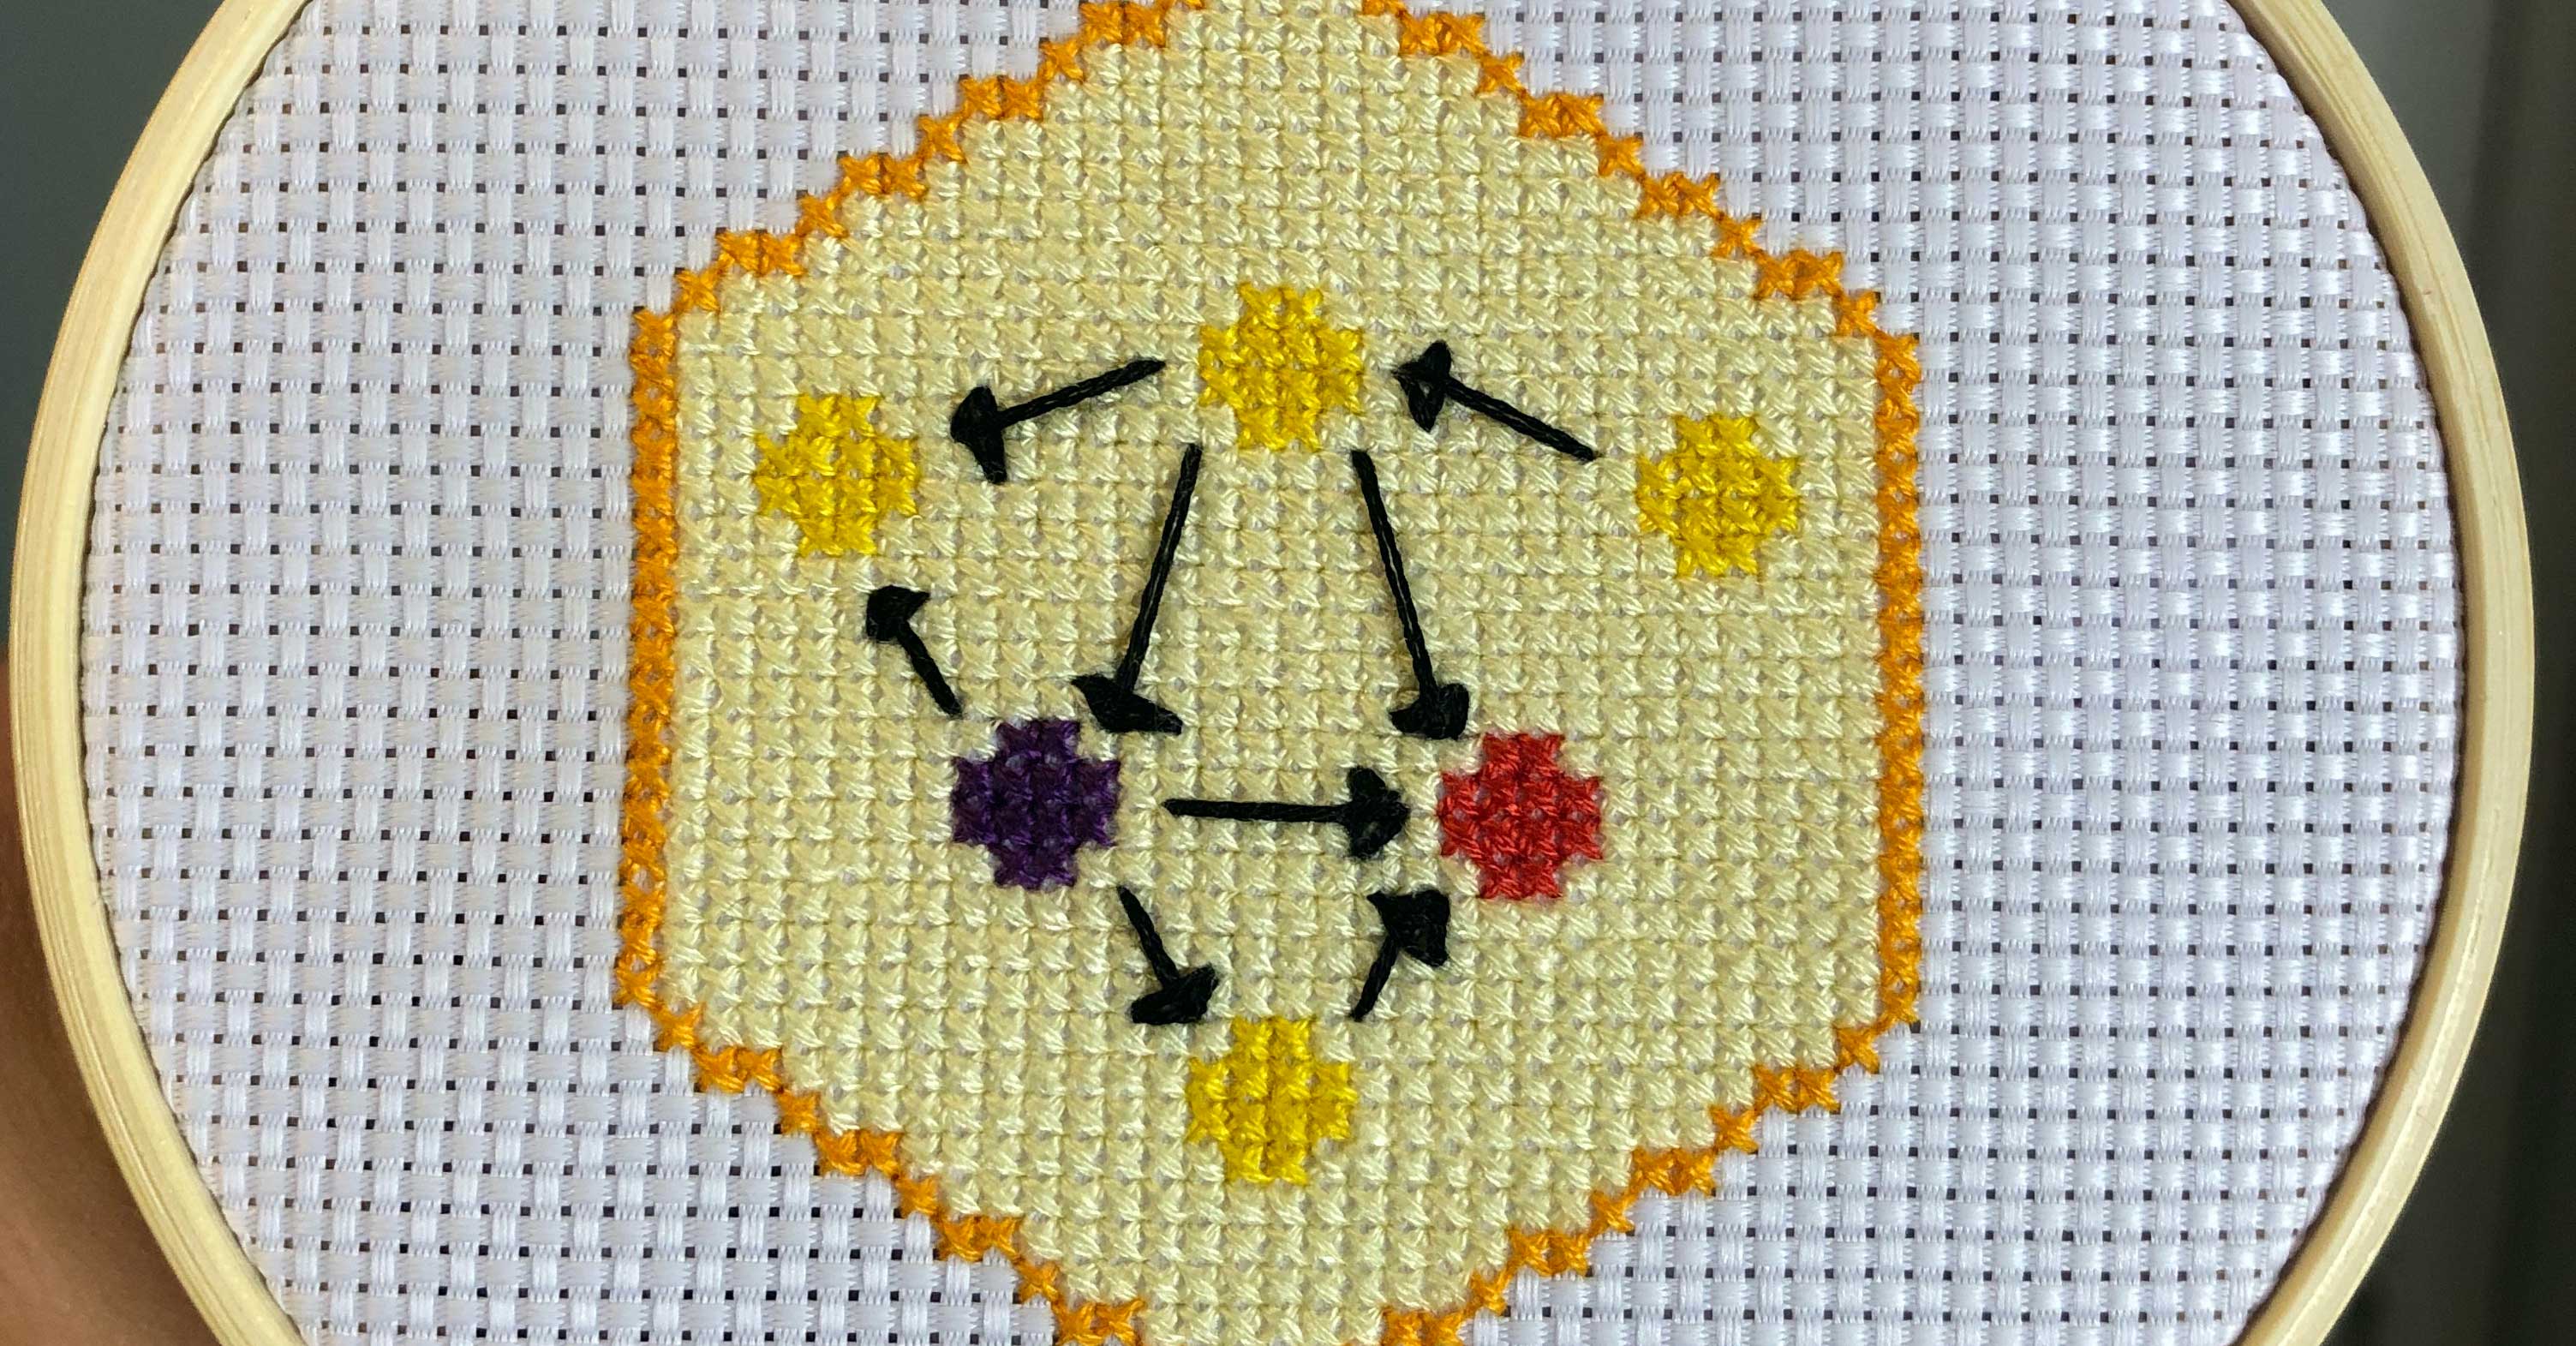
Make your own data science hex logo cross stitch with a free pattern and an Illustrator template
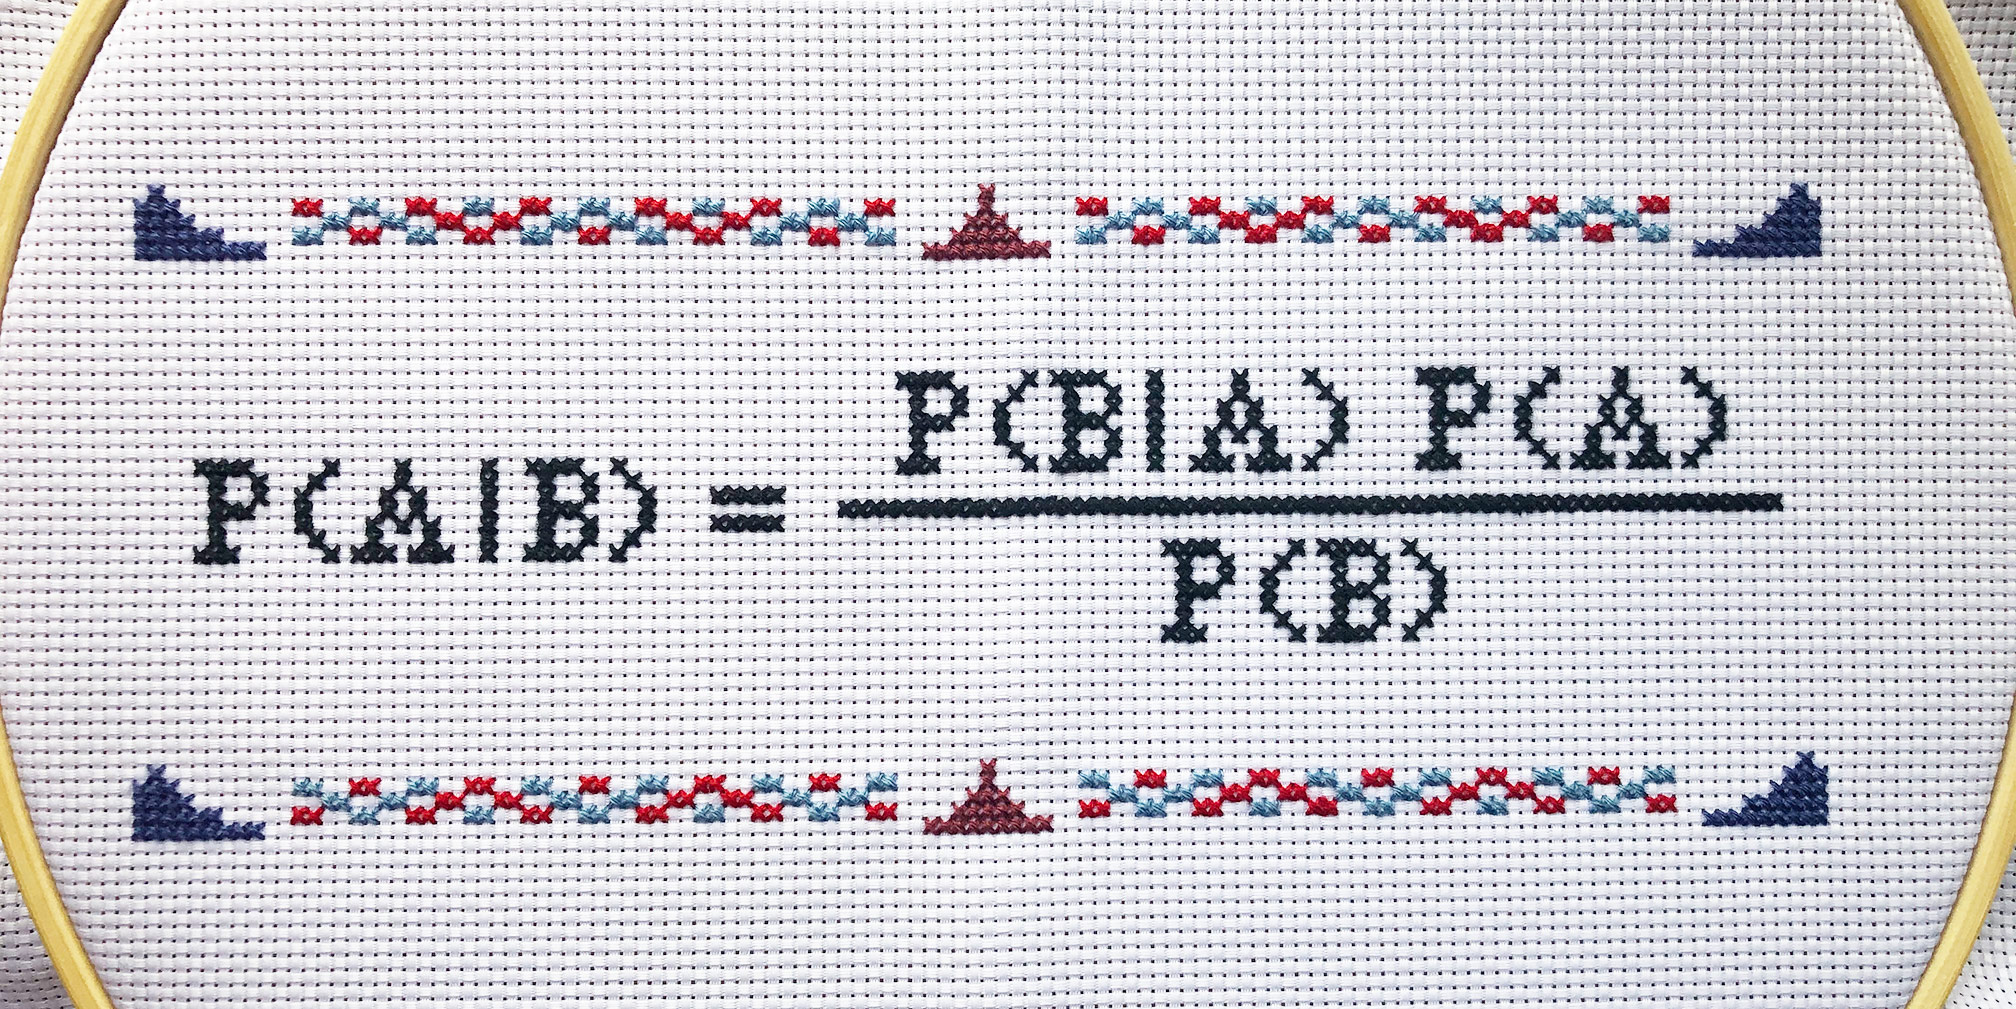
Make your own Bayesian cross stitch sampler with a free pattern of Bayes Theorem and the accompanying Illustrator template
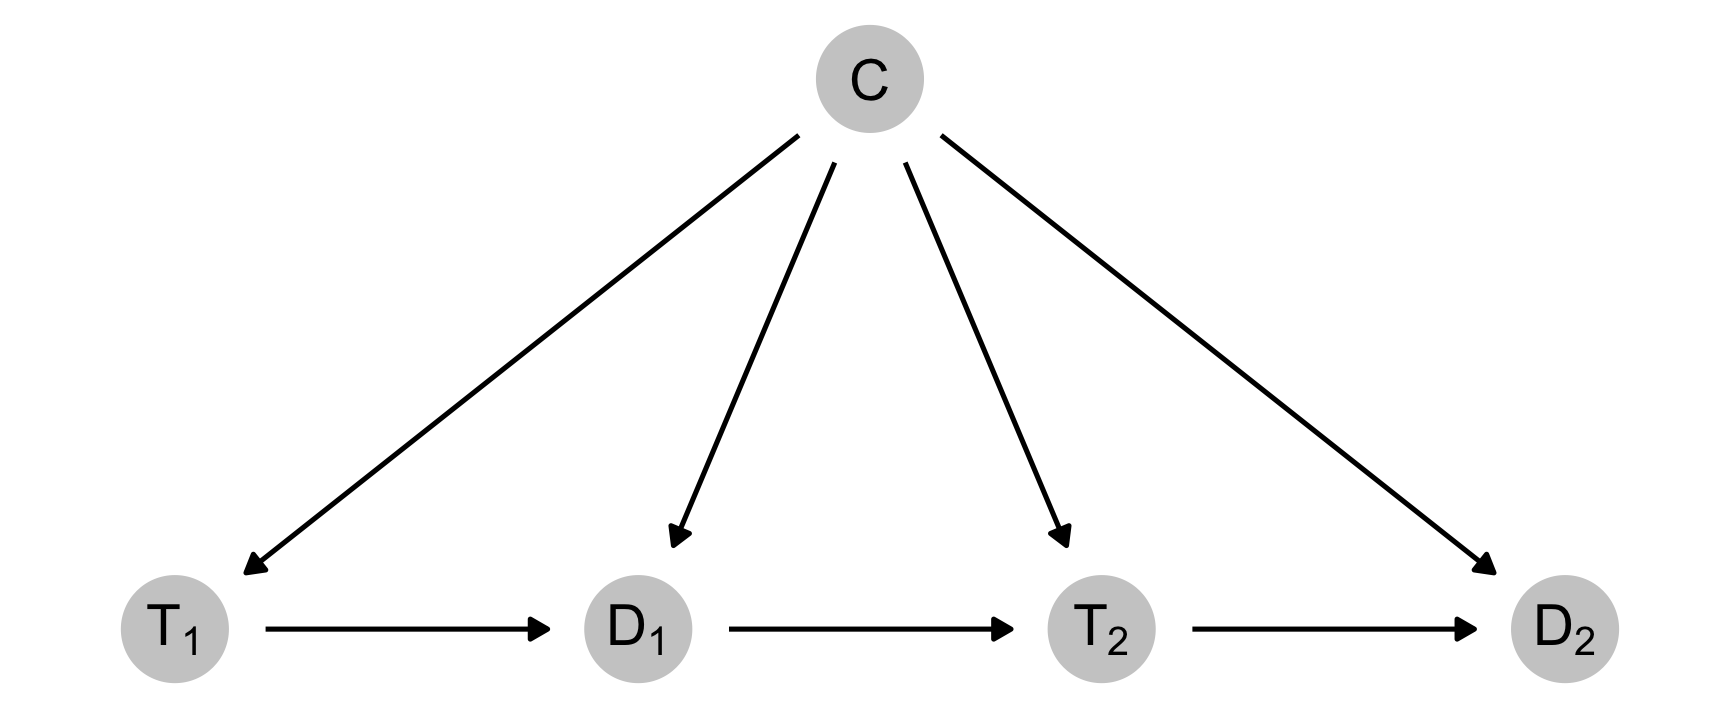
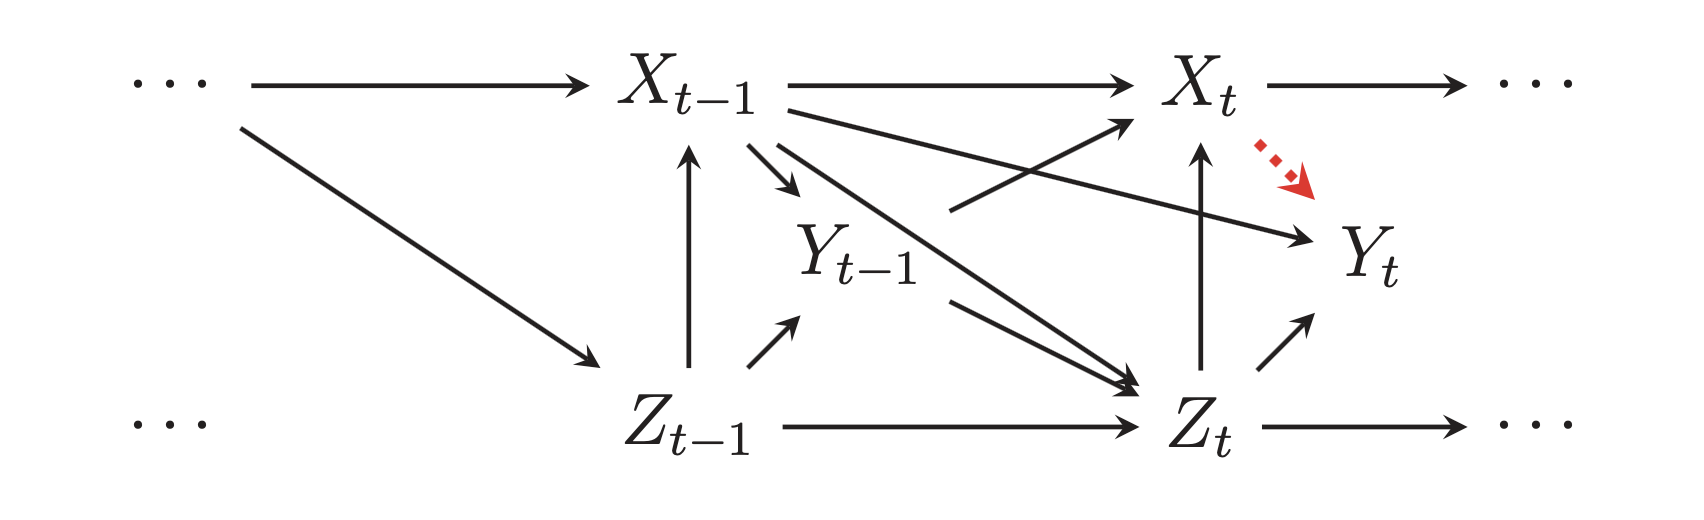
Use R to correctly close backdoor confounding in panel data with marginal structural models and inverse probability weights with both GEE and multilevel models
Use R to close backdoor confounding in panel data with marginal structural models and inverse probability weights for both binary and continuous treatments
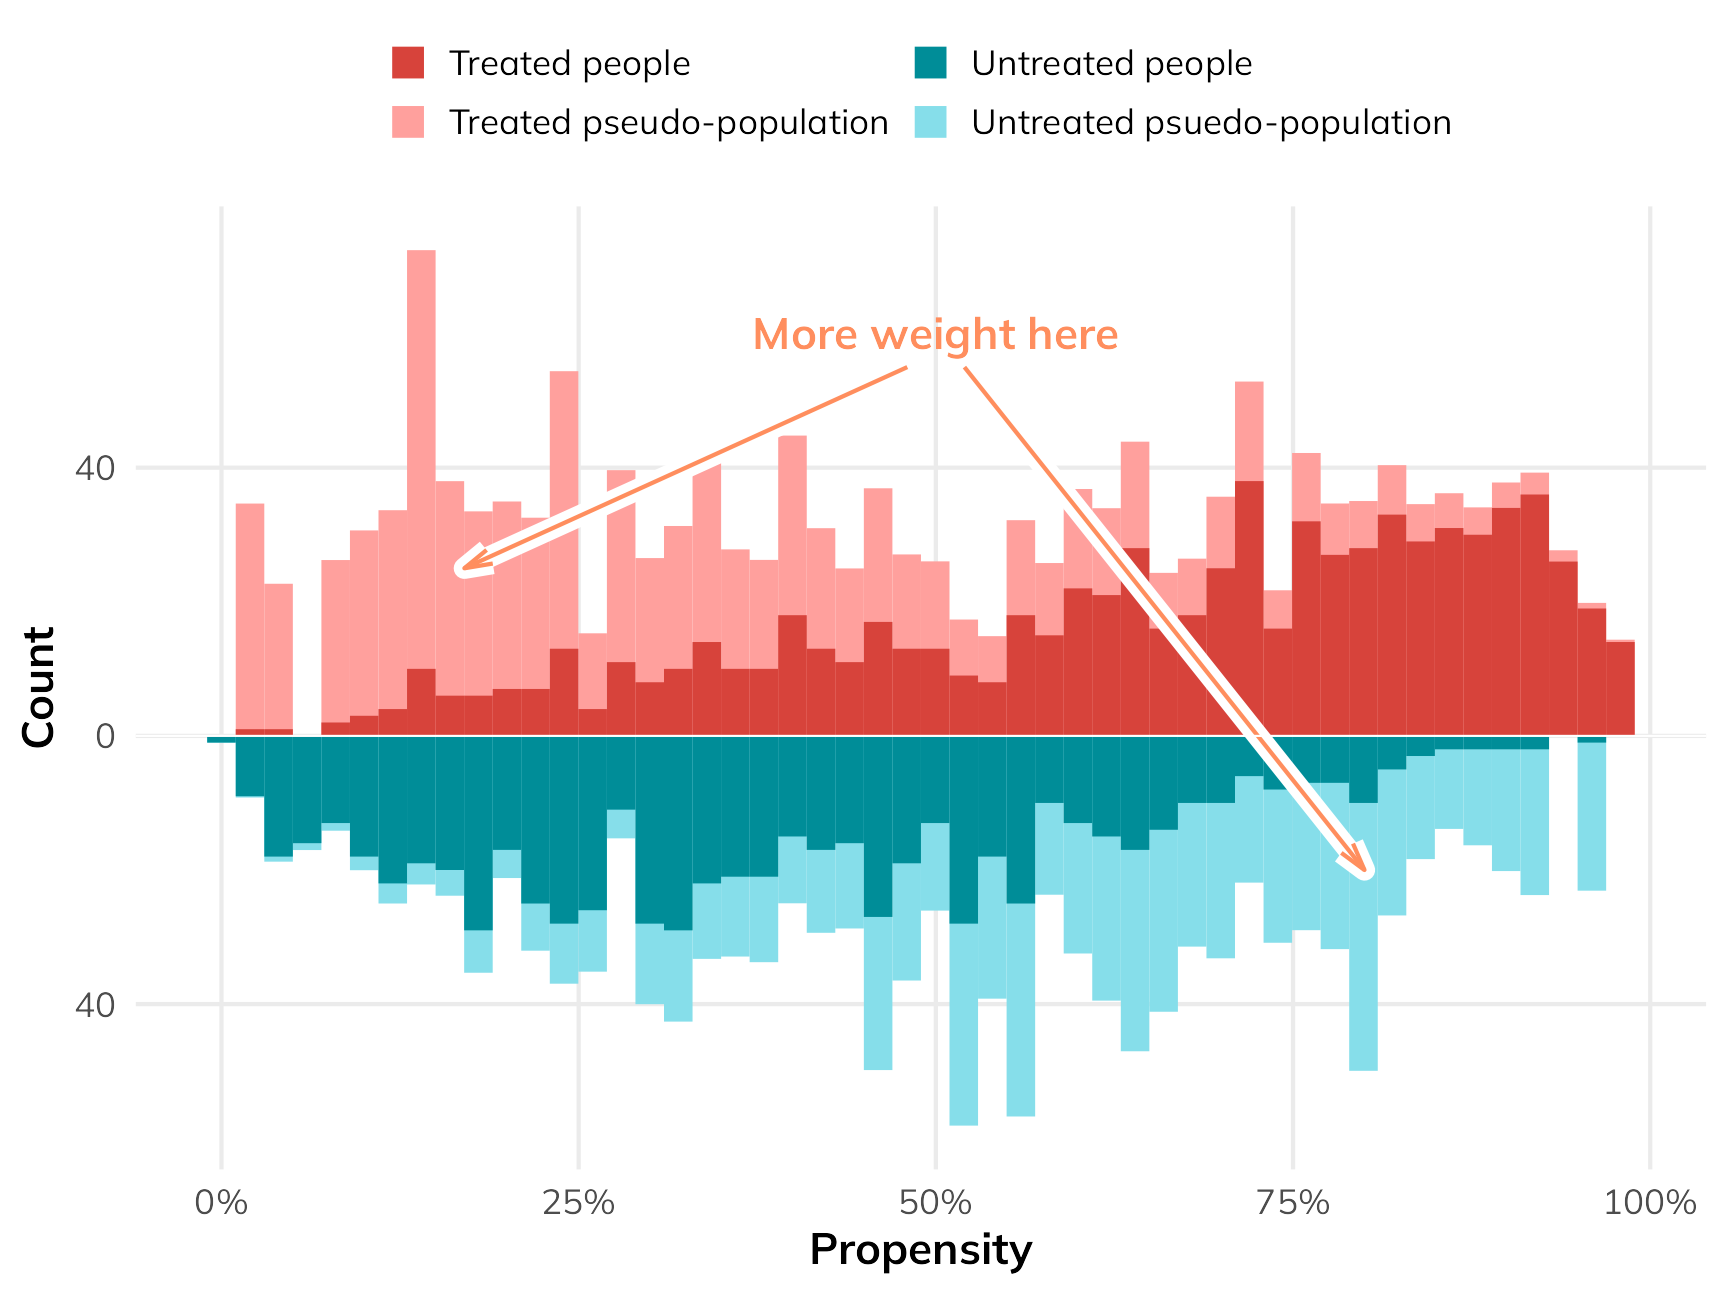
Use R to close backdoor confounding by generating and using inverse probability weights for both binary and continuous treatments
List of resources to help teach online as universities rapidly shut down during the COVID-19 pandemic
Use regression, inverse probability weighting, and matching to close confounding backdoors and find causation in observational data
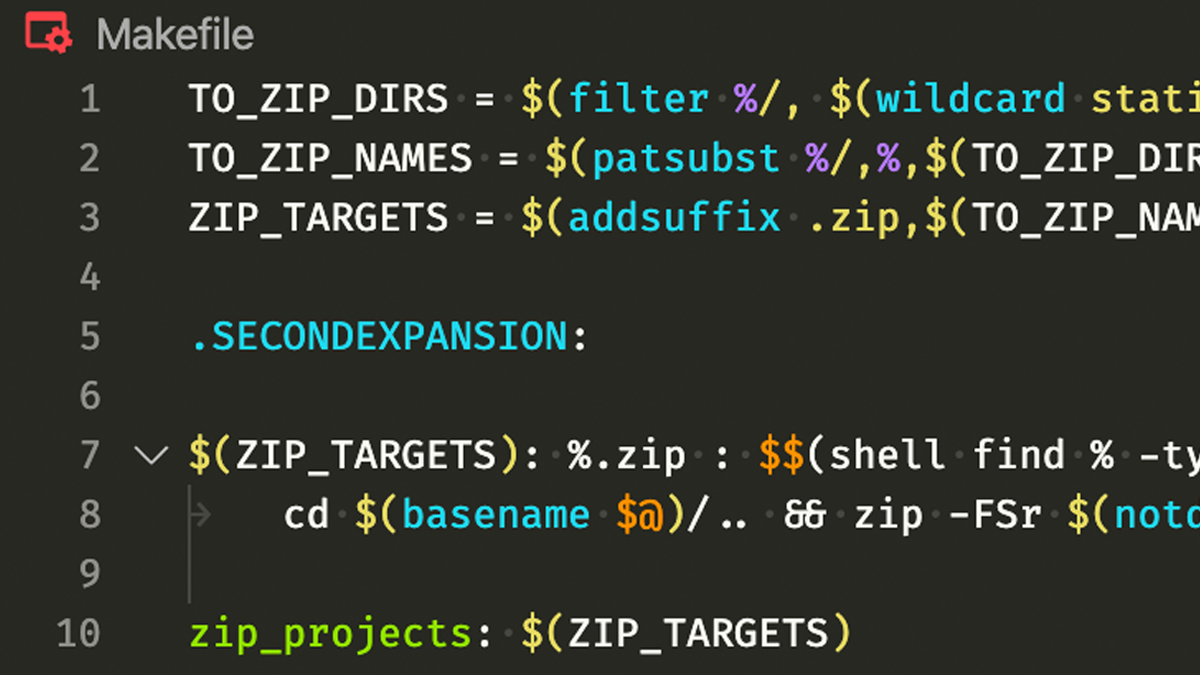
Use a Makefile to automatically zip up all subdirectories in a given folder while also accounting for dependencies
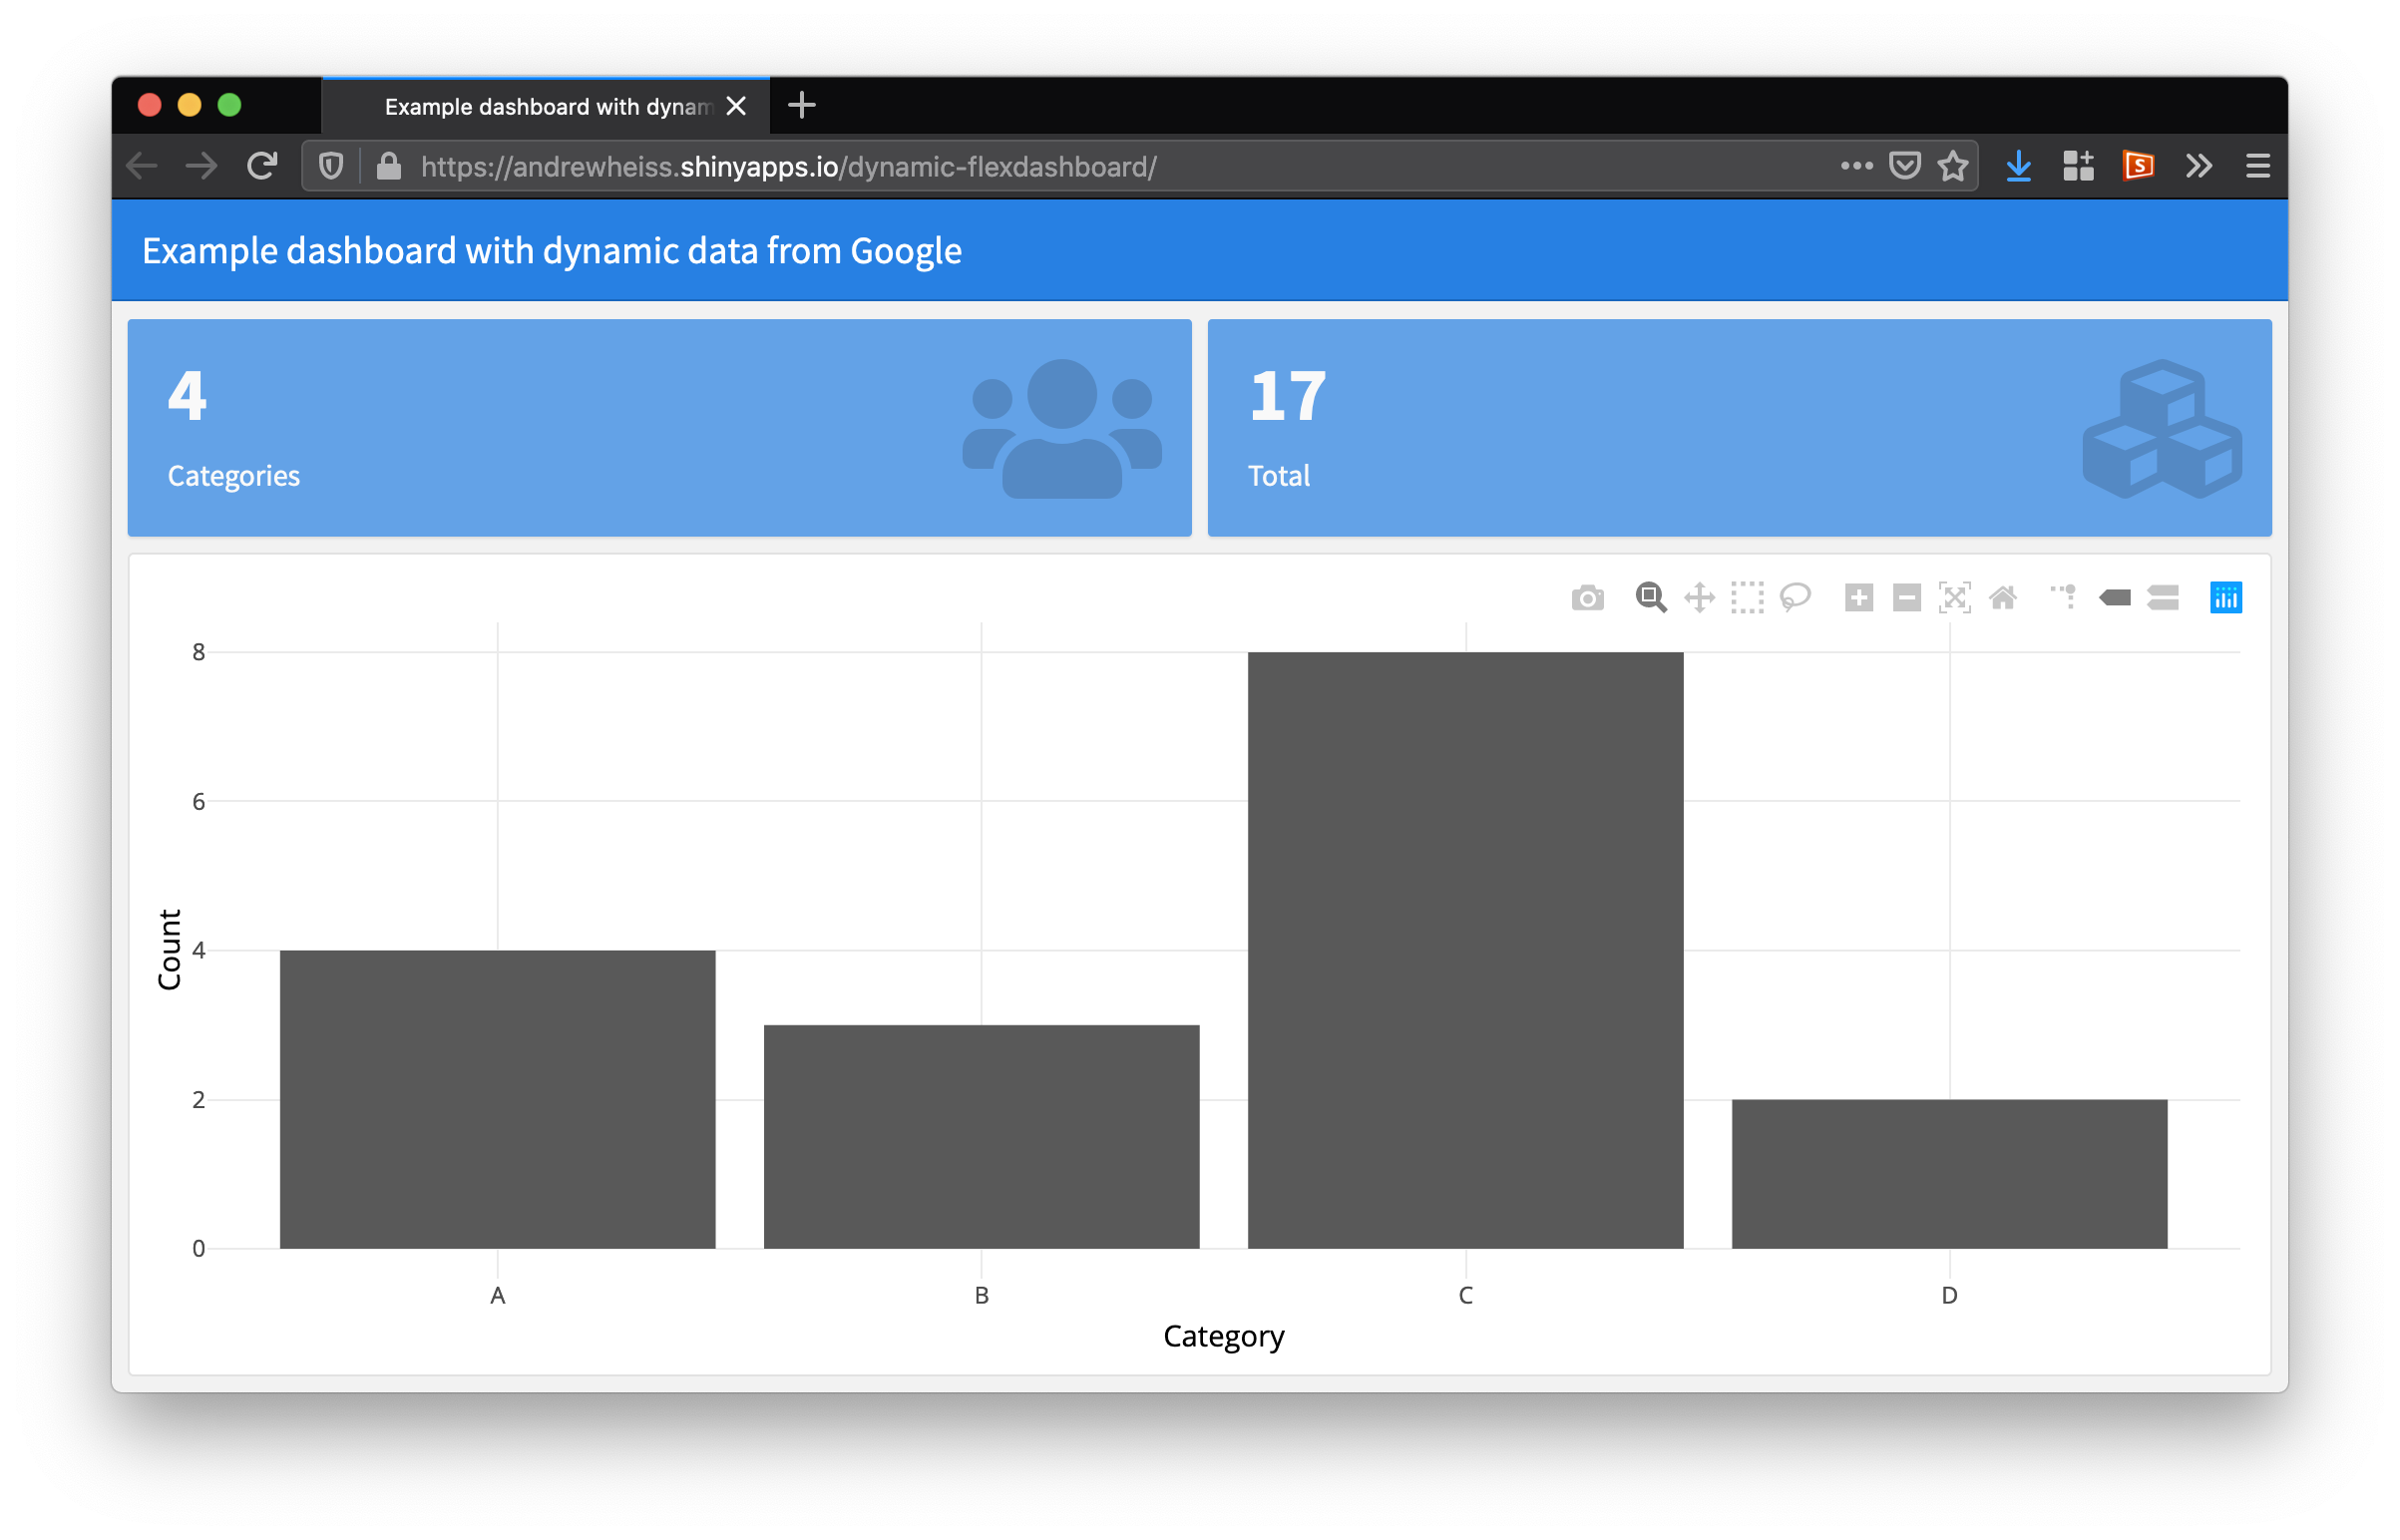
Use R Markdown, flexdashboard, and Shiny to create a dashboard that automatically loads data from a Google Sheet
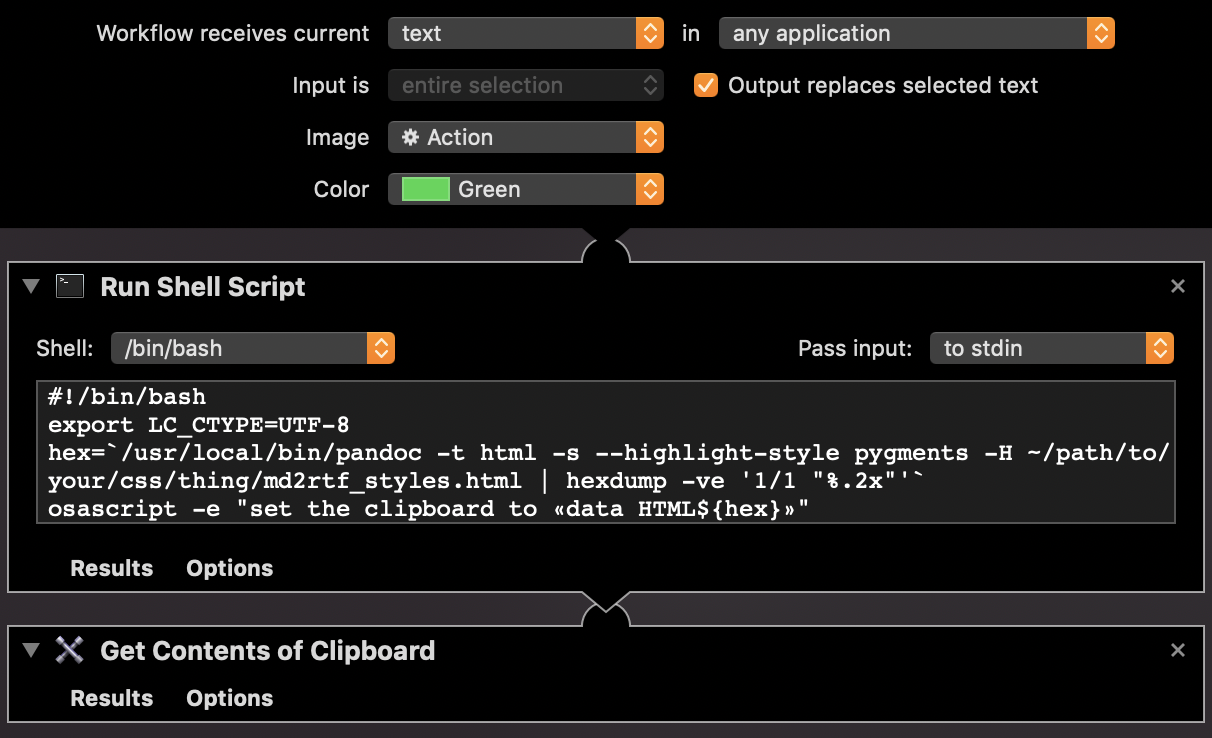
Create a macOS Automator service to convert Markdown to rich text from any app in macOS
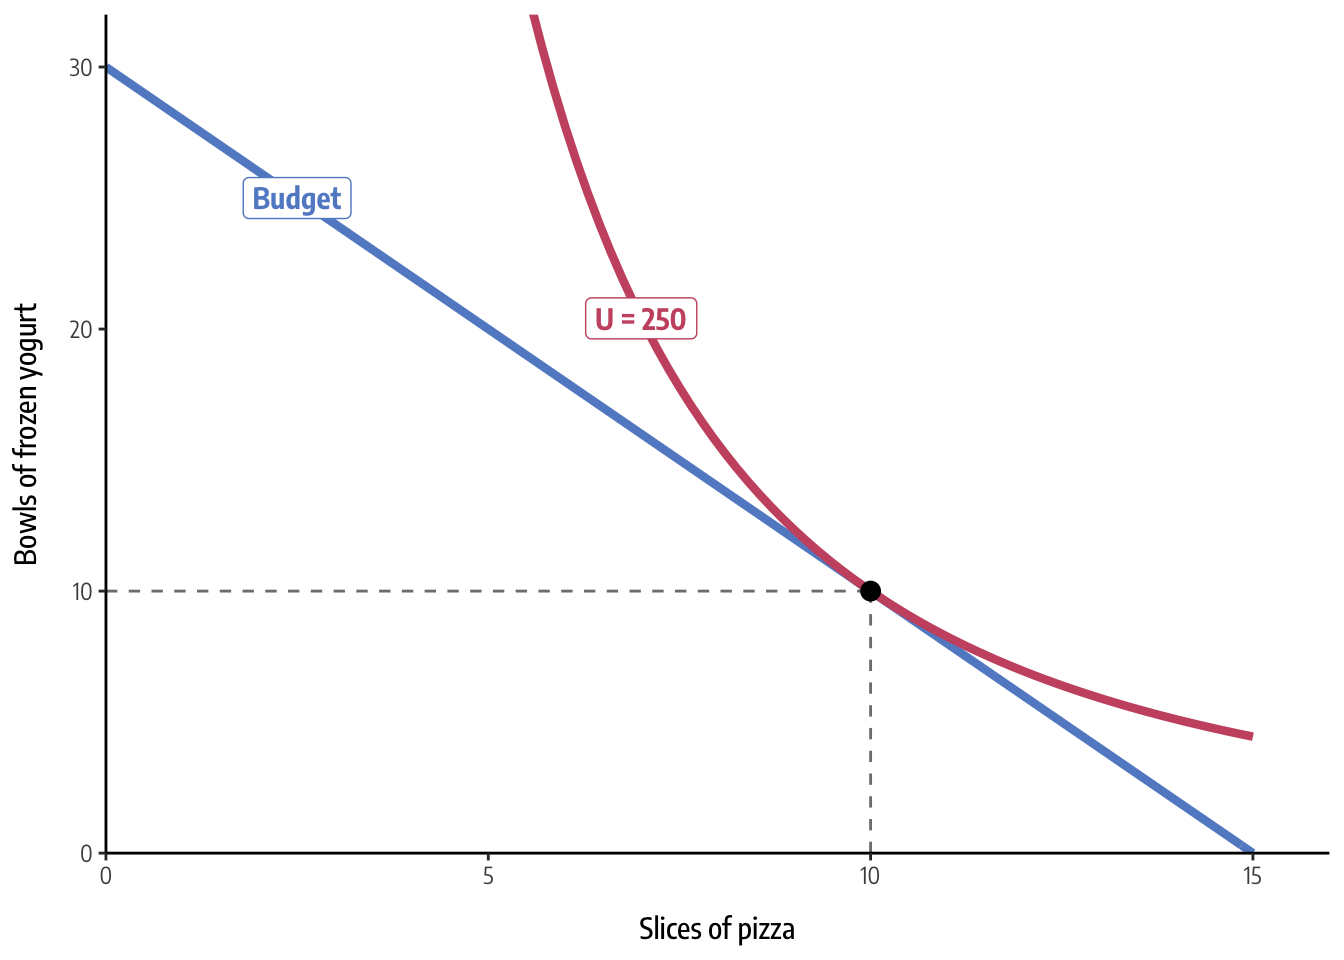
Use algebra and calculus with R and yacas to find Chidi’s optimal level of pizza and frozen yogurt consumption given his budget and utility function.
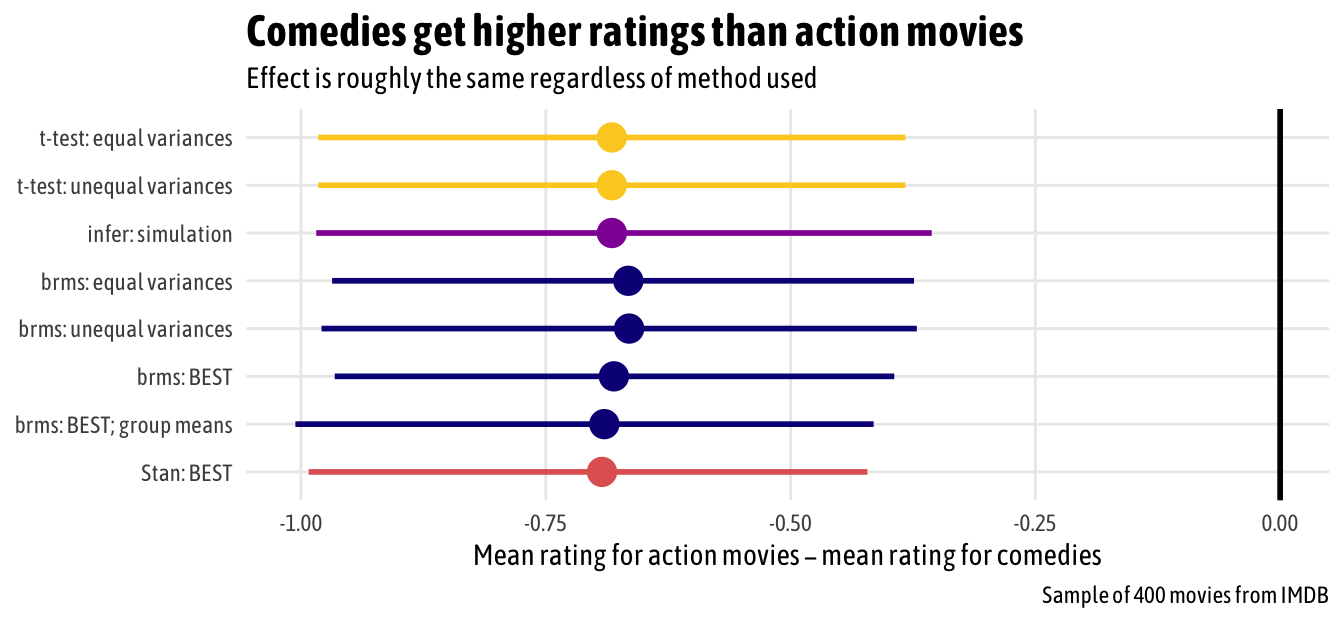
Learn how to run standard t-tests, simulations, and Bayesian difference in means tests with R and Stan
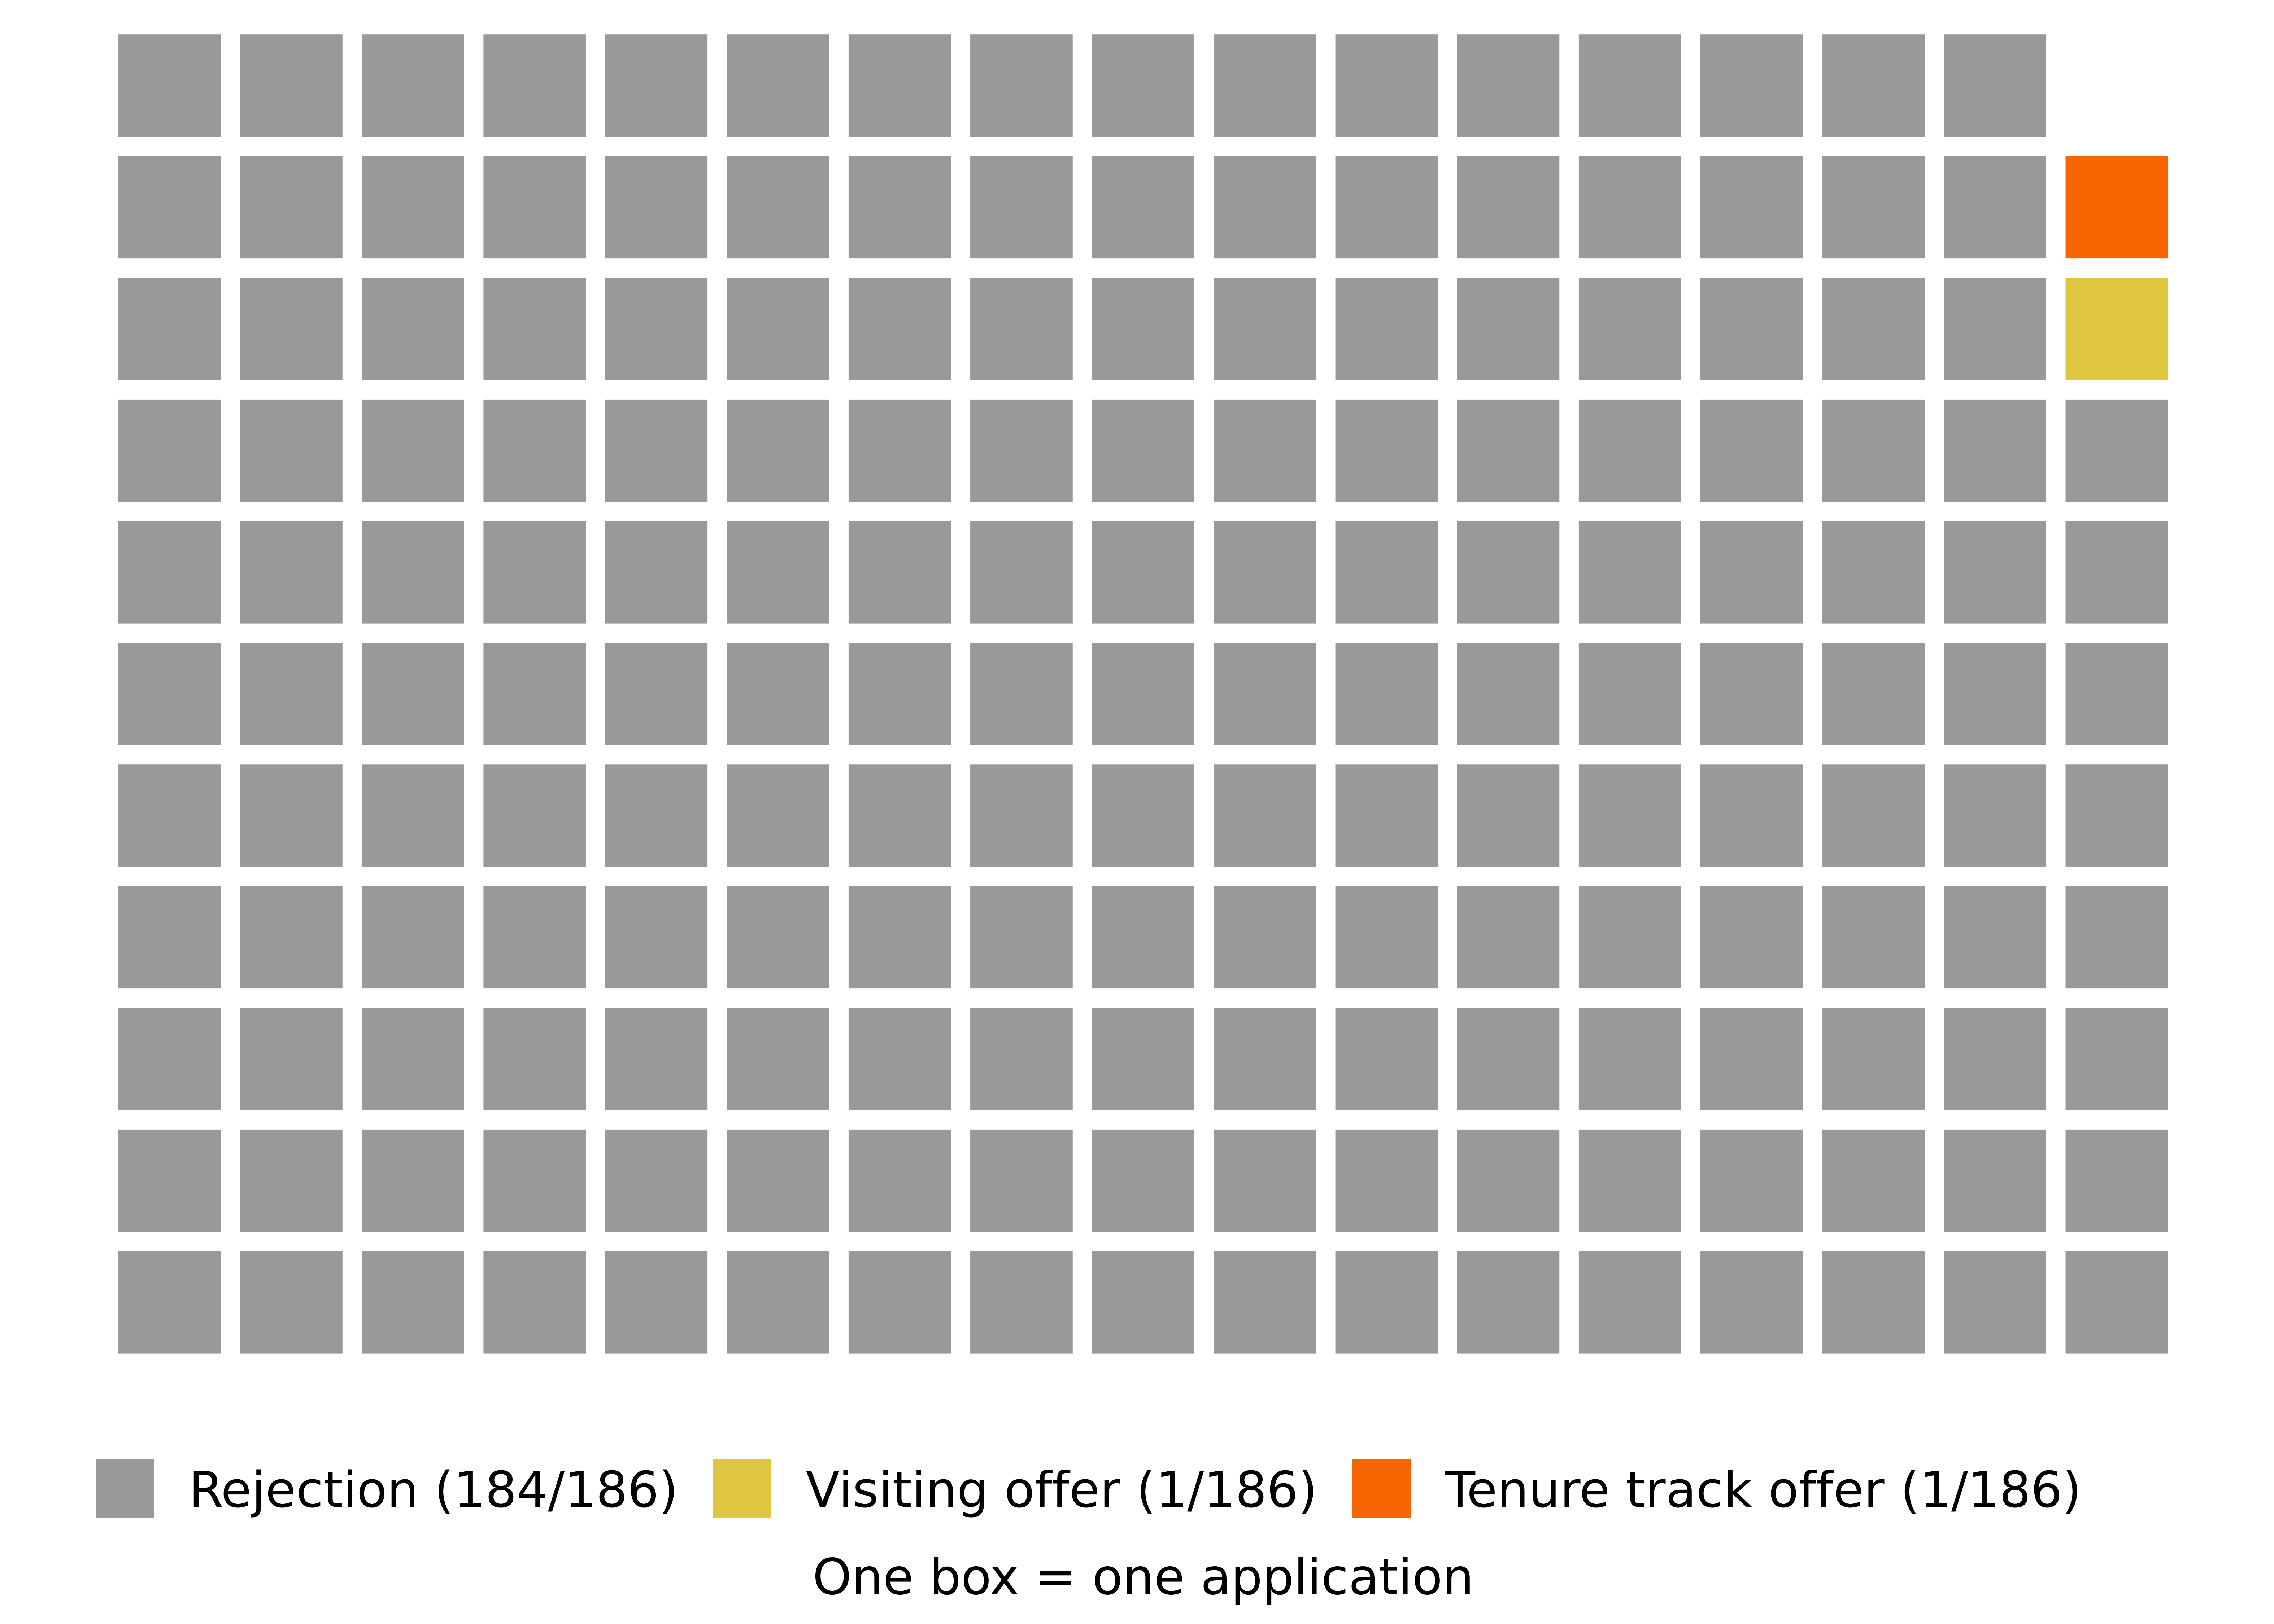
Explore 2.5 years of applying for academic jobs with fancy data visualization
Use the infer package in R to test any statistical hypothesis through simulation.
Use the future R package to run computationally intensive R commands on a cluster of remote computers
Extend broom’s tidy() and glance() to work with lists of multiply imputed regression models
Use tidyverse functions to correctly meld and pool multiply imputed model output.
Use R to do things with derivatives, both with actual functions and with existing empirical data.
The Cairo graphics library makes it easy to embed custom fonts in PDFs and create high resolution PNGs (with either AGG or Cairo).
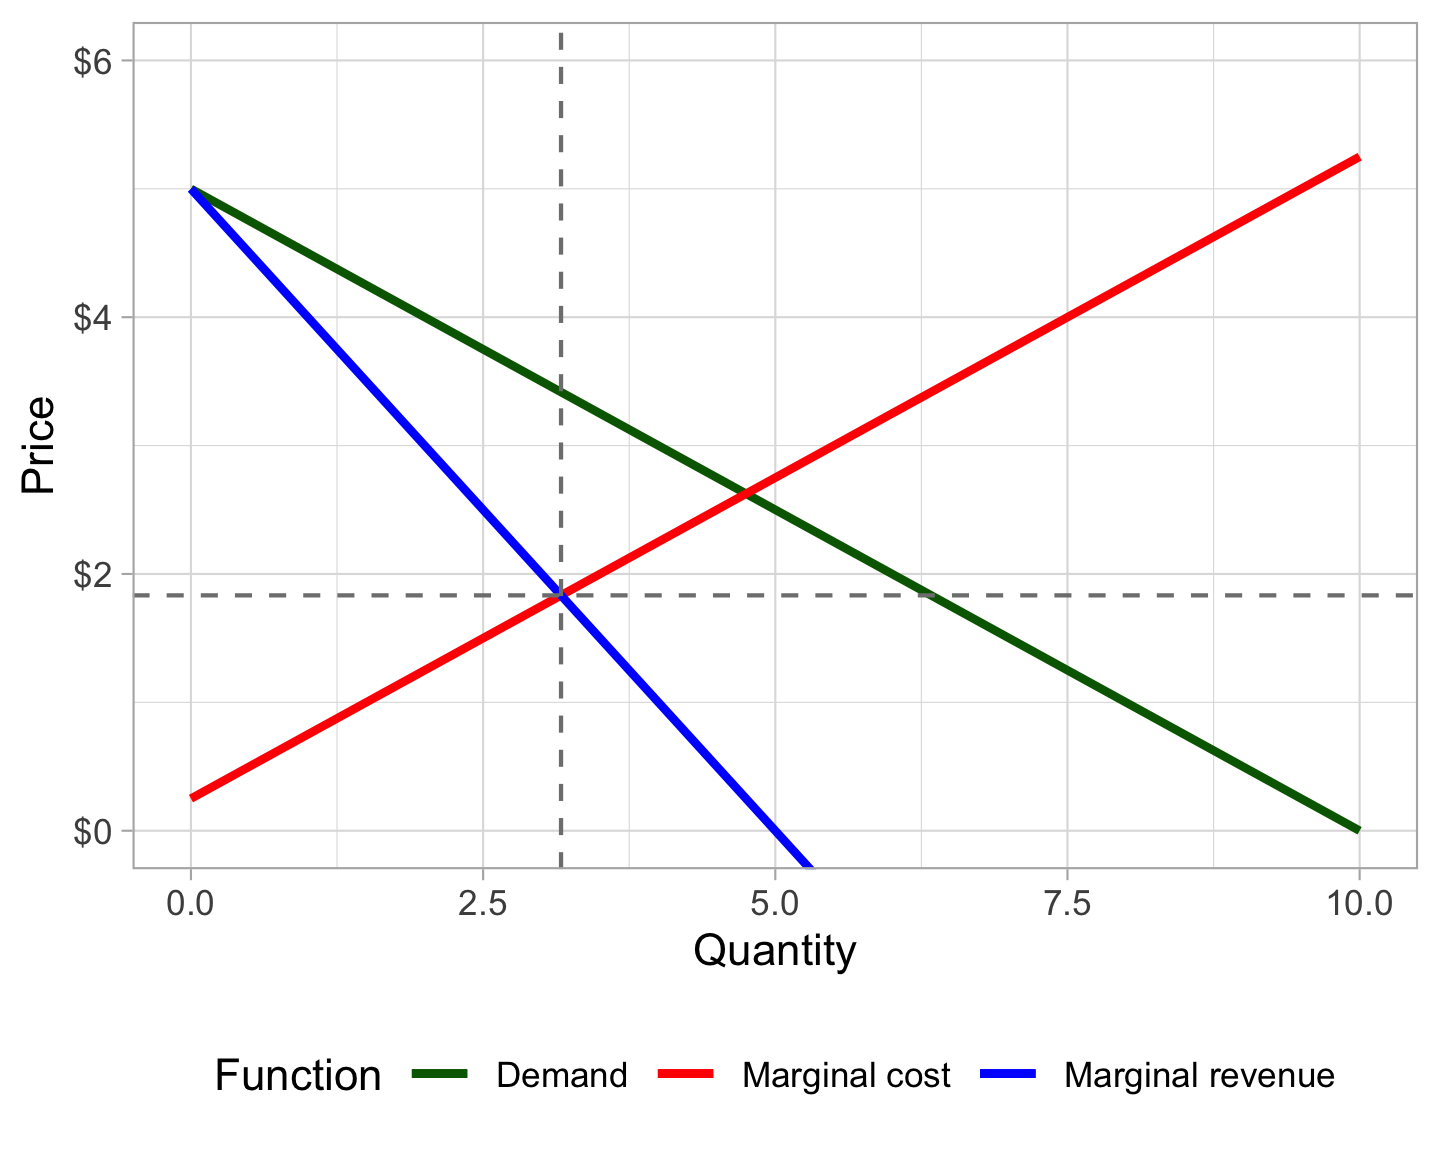
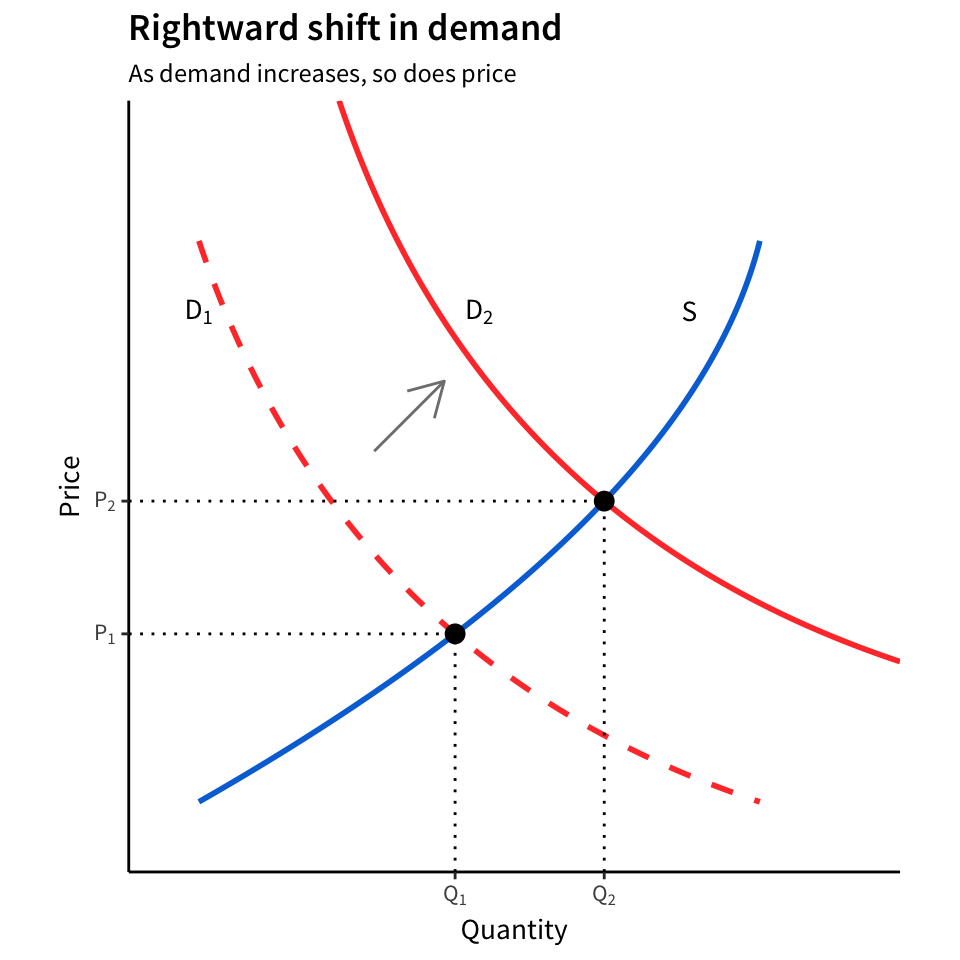
Use ggplot to create economics-style, non-data-based conceptual graphs.