
Now that I’m on the tenure track, I’ve been looking for a way to keep track of my different research projects so I can get them all finished and published. Matt Lebo’s “Managing Your Research Pipeline” presents a neat way of quantifying and tracking the progress of your research, and I recently adopted it for my own stuff. I even made a fancy R Markdown + flexdashboard dashboard to show the status of the pipeline interactively. I manage the data for the dashboard in a Google Sheet, knit the dashboard, and create an HTML file with the latest statistics.
The combination of R Markdown + flexdashboard + ggplotly makes it incredibly easy to create interactive dashboards, but you have to reknit and recompile the dashboard any time any data changes, which I’m not a fan of doing. Wouldn’t it be amazing if there was a way to get the latest data into a dashboard document without any reknitting?
Fortunately there is a way! flexdashboard’s integration with Shiny makes it possible!
Here’s a minimal working example of feeding data from a Google Sheet into a Shiny-based flexdashboard. It has to be hosted on a Shiny server somewhere (like shinyapps.io or on your own server), but you shouldn’t have to reknit ever again!
Step 1: Create a Google Sheet
Go to Google Drive, create a new spreadsheet, and put this data in it:
| Category | Count |
|---|---|
| A | 4 |
| B | 3 |
| C | 8 |
| D | 2 |
You can keep it private, but then you have to deal with OAuth tokens to get it to work with a Shiny server, so it’s easiest here to make it publicly accessible. If you want to work with private data, check the googlesheets4 documentation on authentication. Click on the “Share” button in the top right corner and make the document accessible via a link. You should also make the sheet public by going to File > Publish to the web and publish as a CSV. You can also just use this sheet here if you don’t want to create your own (but this is read only and you won’t be able to edit it and see your changes live).
Step 2: Build a static dashboard
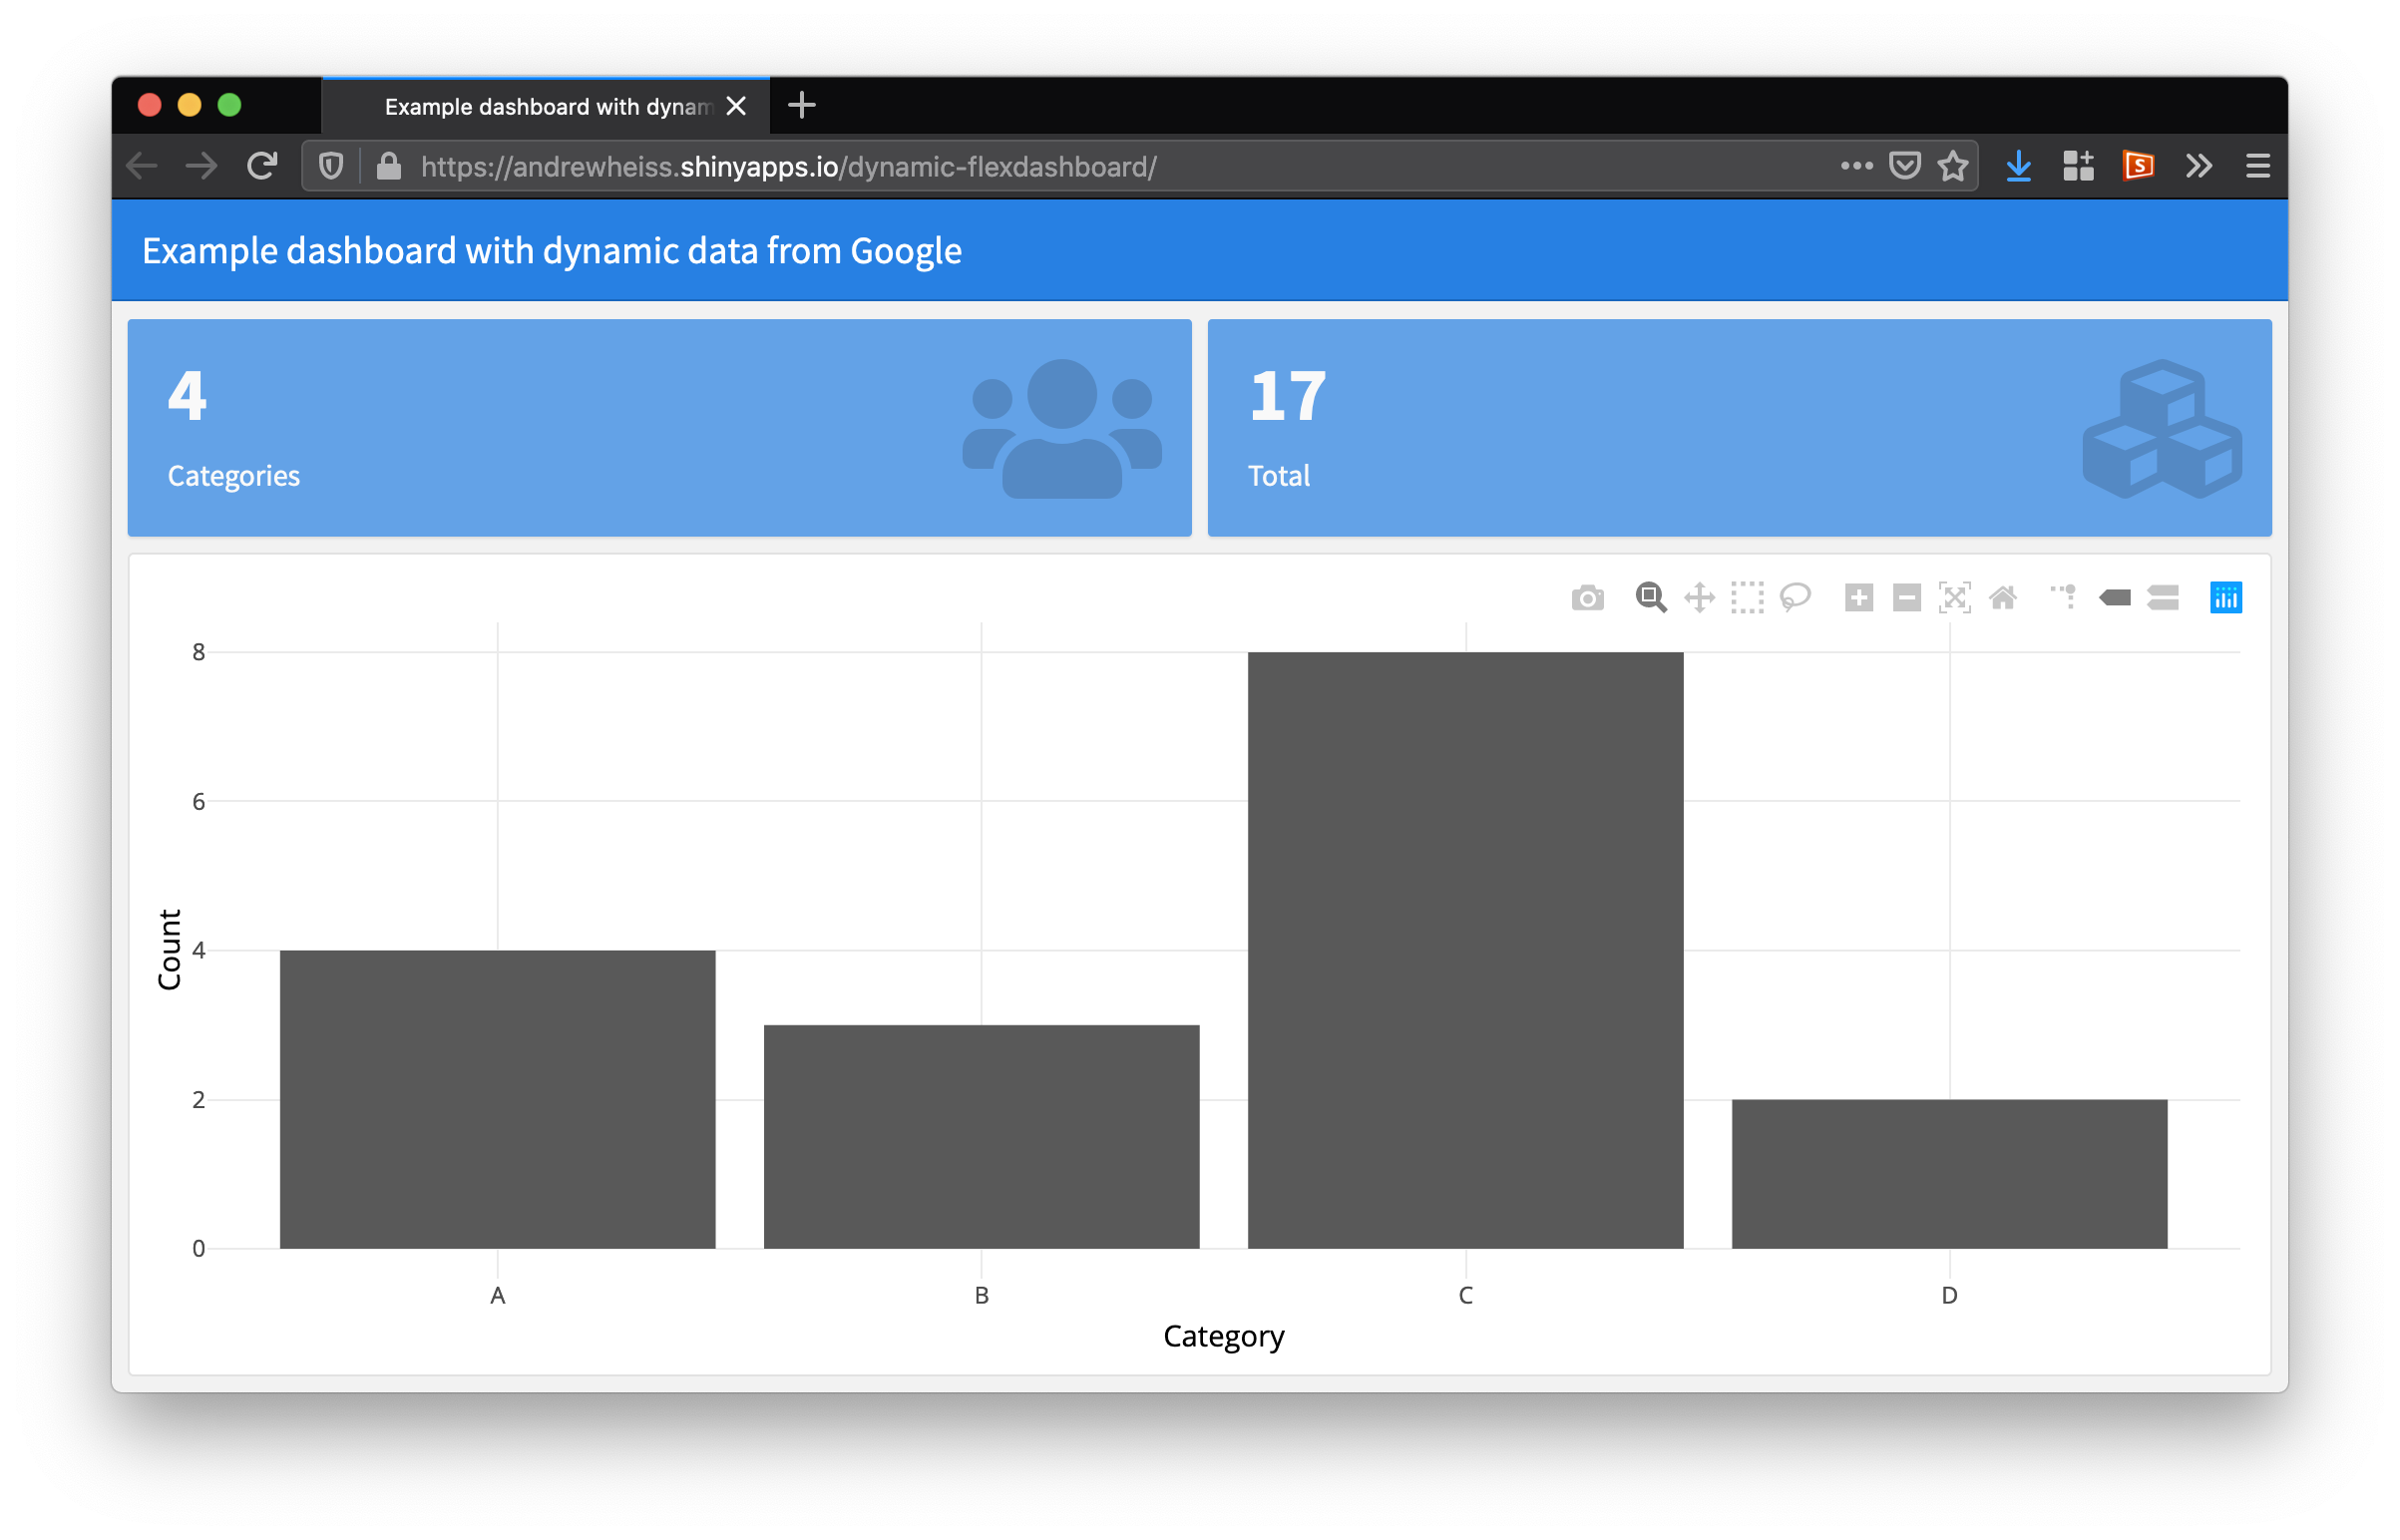
We’ll make a barebones dashboard with a couple big numbers at the top showing a count of categories and the sum of the category counts, and an interactive bar chart at the bottom showing the counts in each category. Check the fantastic documentation for flexdashboard for more details and examples.
Save this as an R Markdown file and knit it—the resulting HTML file is a complete self-contained dashboard.
---
title: "Example dashboard with static data from Google"
output:
  flexdashboard::flex_dashboard:
    orientation: rows
    theme: yeti
---


```{r setup, include=FALSE}
library(tidyverse)
library(googlesheets4)
library(flexdashboard)
library(plotly)

# Make googlesheets4 not try to authenticate, since we're using a public sheet
sheets_deauth()
```

```{r get-data, message=FALSE, include=FALSE}
# The 1RKNn84xVLUanhGyX8DPvDSd8zt4GX_eBmK2ZX2nf0BI comes from the shared link
# URL from Google Sheets. You can also refer to sheets by name if you're
# authenticated into your account. See the googlesheets4 documentation for more
# details
remote_data <- read_sheet("1RKNn84xVLUanhGyX8DPvDSd8zt4GX_eBmK2ZX2nf0BI")
```

## Row

### Categories {.value-box}

```{r}
# Find the number of unique categories
n_categories <- remote_data %>% distinct(Category) %>% nrow()

# Show the number in a special valueBox (note the {.value-box} CSS class
# above—that applies the CSS class to the HTML output and makes it render
# correctly)
valueBox(value = n_categories, icon = "fas fa-users")
```

### Total {.value-box}

```{r}
# Get a total of all the counts
total <- sum(remote_data$Count)

# Show the number in a valueBox
valueBox(value = total, icon = "fas fa-cubes")
```

## Row

###

```{r}
# Make a basic column plot
my_plot <- ggplot(remote_data, aes(x = Category, y = Count)) +
  geom_col(aes(text = Count)) +
  theme_minimal()

# Show the plot with plotly
ggplotly(my_plot, tooltip = "text")
```
Step 3: Make static dashboard dynamic
The only problem with this dashboard is that it’s now the same every time you visit it. If you update the data in the Google Sheet, those changes won’t be reflected in the dashboard unless you reknit the document.
We can make the dashboard dynamic with some basic shinyfication: we can put the data reading into a function that gets rerun when the page is reloaded, and we can put valueBox() and ggplotly() inside functions that connect them to the more dynamic data. This only requires a few changes—here’s the same static dashboard with the Shiny bits added.
---
title: "Example dashboard with dynamic data from Google"
output:
  flexdashboard::flex_dashboard:
    orientation: rows
runtime: shiny  # Make this use a Shiny backend
---


```{r setup, include=FALSE}
library(tidyverse)
library(googlesheets4)
library(flexdashboard)
library(plotly)

# Make googlesheets4 not try to authenticate, since we're using a public sheet
sheets_deauth()
```

```{r get-data, message=FALSE, include=FALSE}
# Create a function that reads the data from Google. I've seen other examples
# that make this a reactive(), but I don't really know what that is since I
# rarely use Shiny :shrug:
#
# I'm also not completely sold that this is the right approach, since this feels
# kind of roundabout (create a function, run the function), but it doesn't work
# if you just do remote_data <- read_sheet(). Also :shrug: for now.
#
# ALSO flexdashboard can use a special global chunk to speed up expensive data
# loading (https://rmarkdown.rstudio.com/flexdashboard/shiny.html#loading_data),
# which I assume also includes loading data remotely from Google, but if you
# name this chunk global, the dynamic data loading stops working. Once again,
# big :shrug:.
load_remote_data <- function() {
  read_sheet("1RKNn84xVLUanhGyX8DPvDSd8zt4GX_eBmK2ZX2nf0BI")
}

remote_data <- load_remote_data()
```

## Row

### Categories {.value-box}

```{r}
n_categories <- remote_data %>% distinct(Category) %>% nrow()

# Put valueBox() inside renderValueBox({})
renderValueBox({
  valueBox(value = n_categories, icon = "fas fa-users")
})
```


### Total {.value-box}

```{r}
total <- sum(remote_data$Count)

# Put valueBox() inside renderValueBox({})
renderValueBox({
  valueBox(value = total, icon = "fas fa-cubes")
})
```

## Row

###

```{r}
my_plot <- ggplot(remote_data, aes(x = Category, y = Count)) +
  geom_col(aes(text = Count)) +
  theme_minimal()

# Put ggplotly() inside renderPlotly({})
renderPlotly({
  ggplotly(my_plot, tooltip = "text")
})
```
Step 4: Check the dynamicness
Edit the Google Sheet, refresh the Shiny app, and you should see everything change in real time!
Step 5: Publish somewhere
The easiest way to publish the Shiny-based dashboard is to click on the “Publish” menu in the top right corner of the RStudio preview window and then go through the menus to publish the document at shinyapps.io. Here’s mine.
And that’s it! An R Markdown-based flexdashboard that dynamically loads data from a Google Sheet. There are probably better ways to load the data (like somehow using the global chunk?), but this works well enough!
Citation
@online{heiss2020,
  author = {Heiss, Andrew},
  title = {Create a Dynamic Dashboard with {R,} Flexdashboard, and
    {Shiny}},
  date = {2020-01-01},
  url = {https://www.andrewheiss.com/blog/2020/01/01/flexdashboard-dynamic-data/},
  doi = {10.59350/8vtys-s0p68},
  langid = {en}
}